Kubecost Dashboard for Grafana Cloud
Cluster cost overview for Kubecost running Grafana Cloud's Managed Prometheus in the backend.
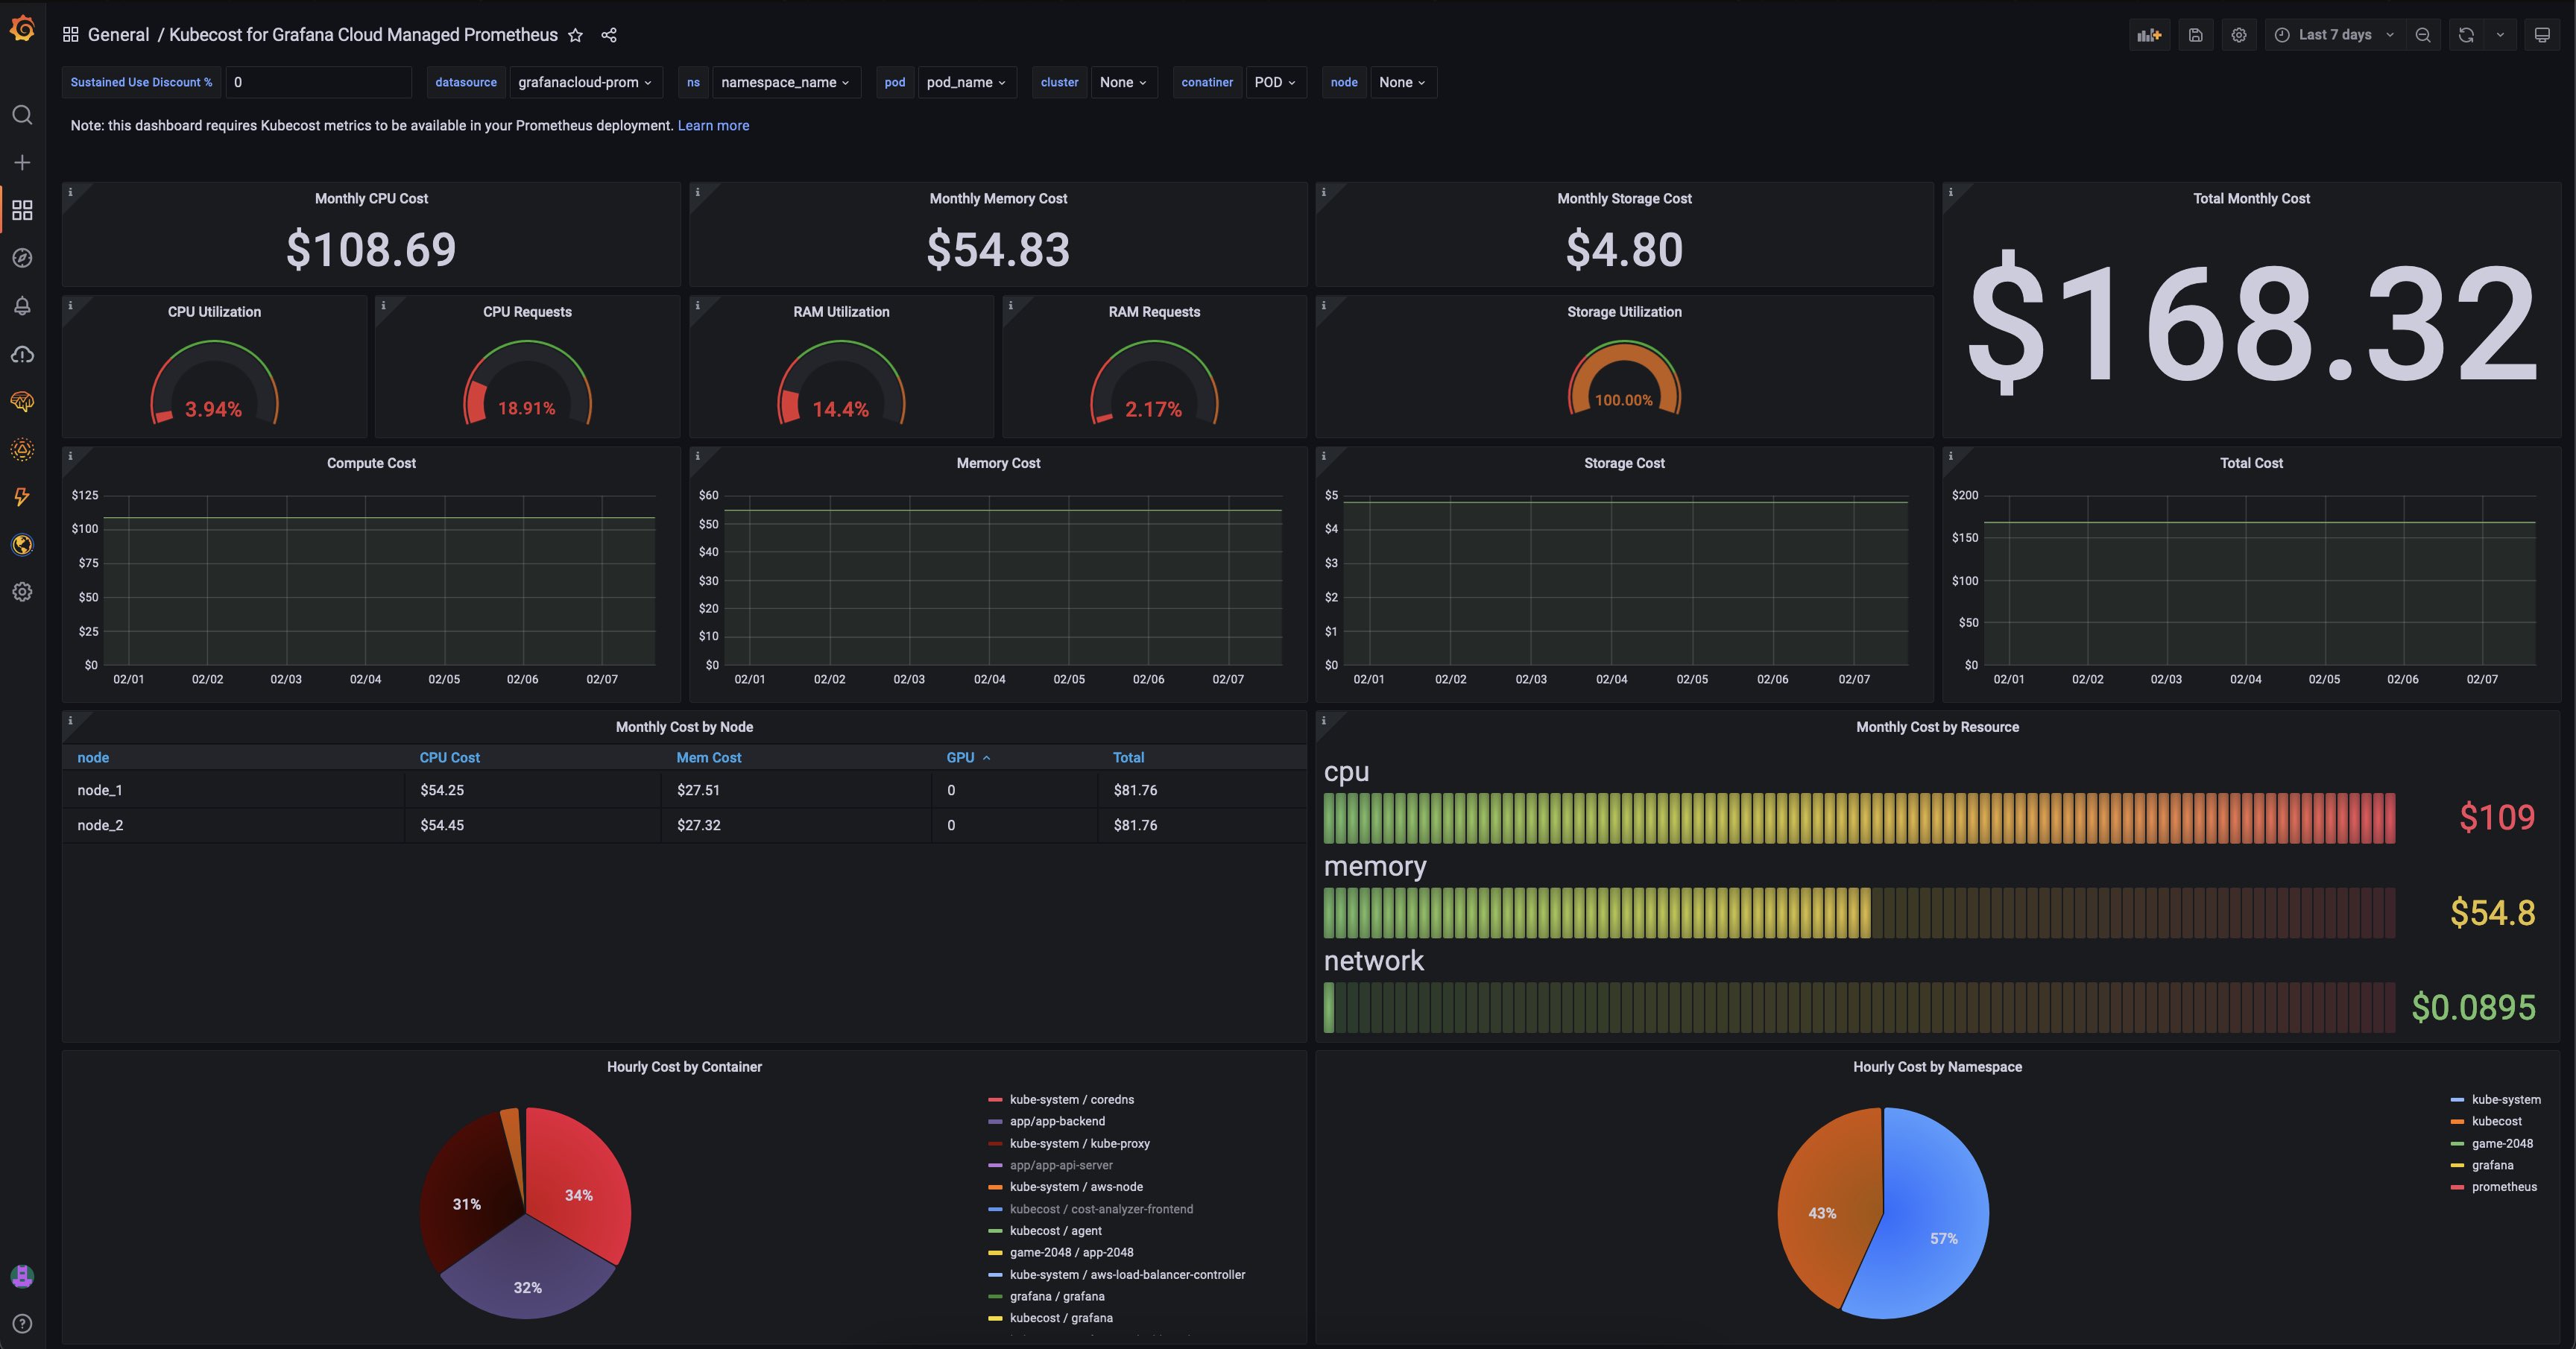
Grafana Dashboard for Kubecost+Grafana Cloud
This Dashboard provides customers leveraging the Grafana Cloud Managed Prometheus with a way to visualise their cost spend.
If you haven't set up Kubecost to query the Grafana Cloud Managed Prometheus, please see the documentation.
Once you've set it up, simply copy the URL of this dashboard and import it into your Grafana Cloud dashboards. Make sure to select the Managed Prometheus as a data source for the Kubecost dashboard.
Data source config
Collector type:
Collector plugins:
Collector config:
Revisions
Upload an updated version of an exported dashboard.json file from Grafana
| Revision | Description | Created | |
|---|---|---|---|
| Download |