
CH Data Dictionary Viewer
ChDDV (ClickHouse Data Dictionary Viewer) displays most important informations on table/column definition. It also shows a cool graph with relationship between tables using the Node Graph plugin (Beta).
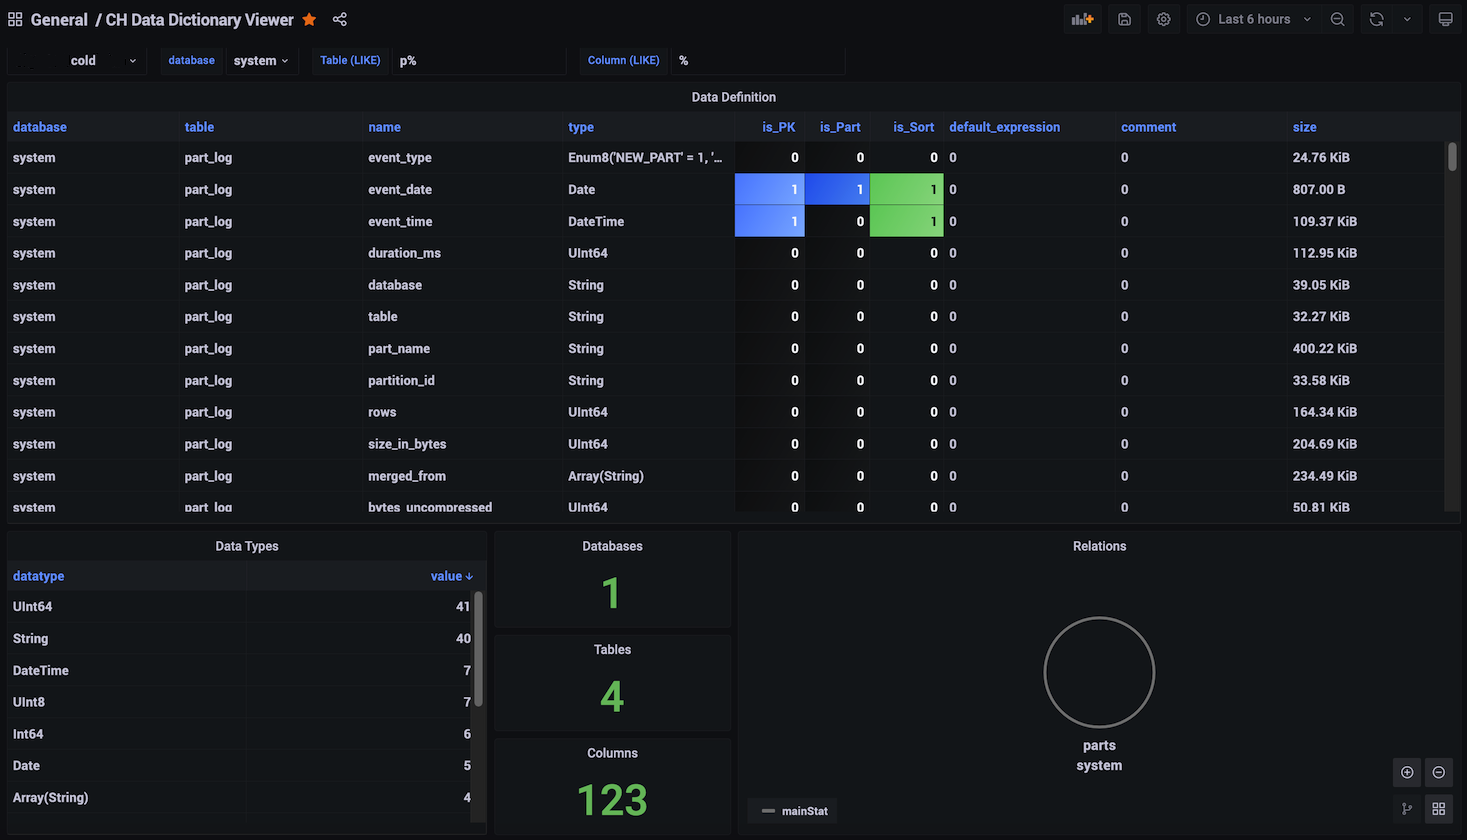
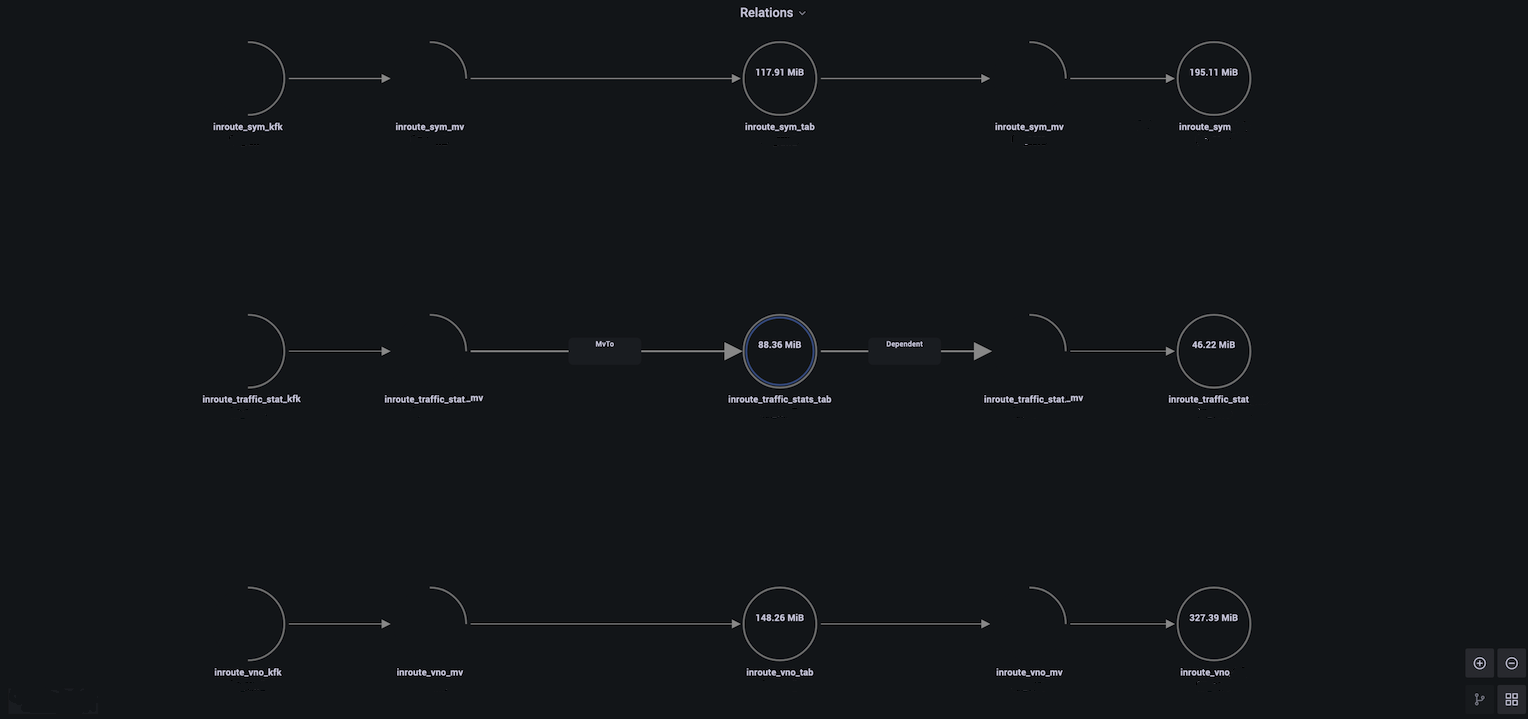
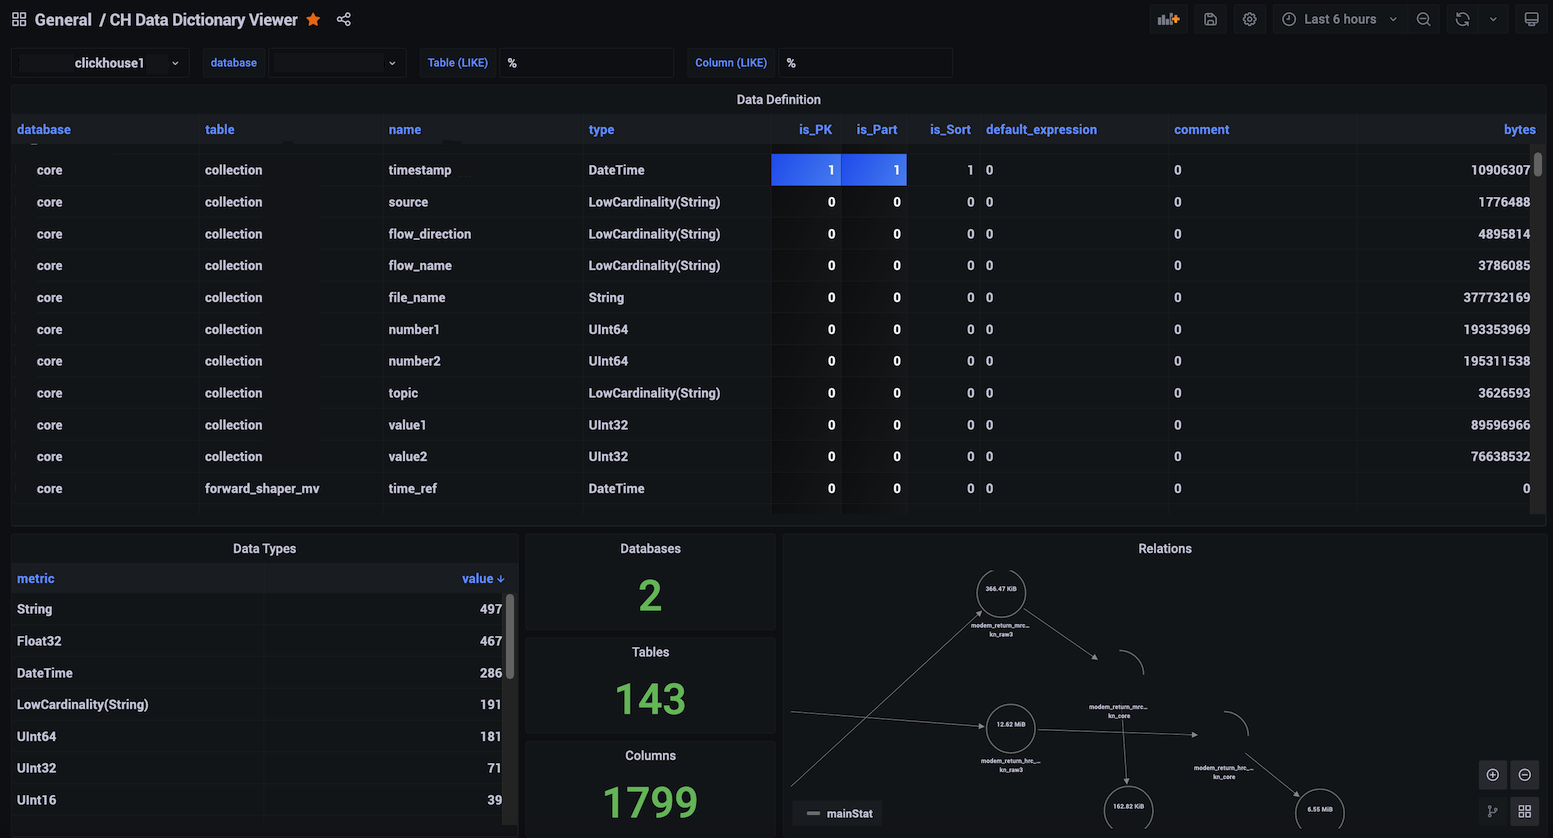
The dashboard shows columns attributes, most used data types and a graph with relationships between tables (eg. materialized views moving data from a Kafka Engine table to a MergeTree table). You can choose databases, tables and columns to be shown using variables. This dashboard does not require any data collection since it uses the standard data dictionary tables in the system database.
Data source config
Collector type:
Collector plugins:
Collector config:
Revisions
Upload an updated version of an exported dashboard.json file from Grafana
| Revision | Description | Created | |
|---|---|---|---|
| Download |