Telegraf Metrics dashboard for InfluxDB 2.0 (Flux)
Dashboard for displaying basic host metrics collected by telegraf and stored into the InfluxDB 2.0. Metrics are fetched by flux.
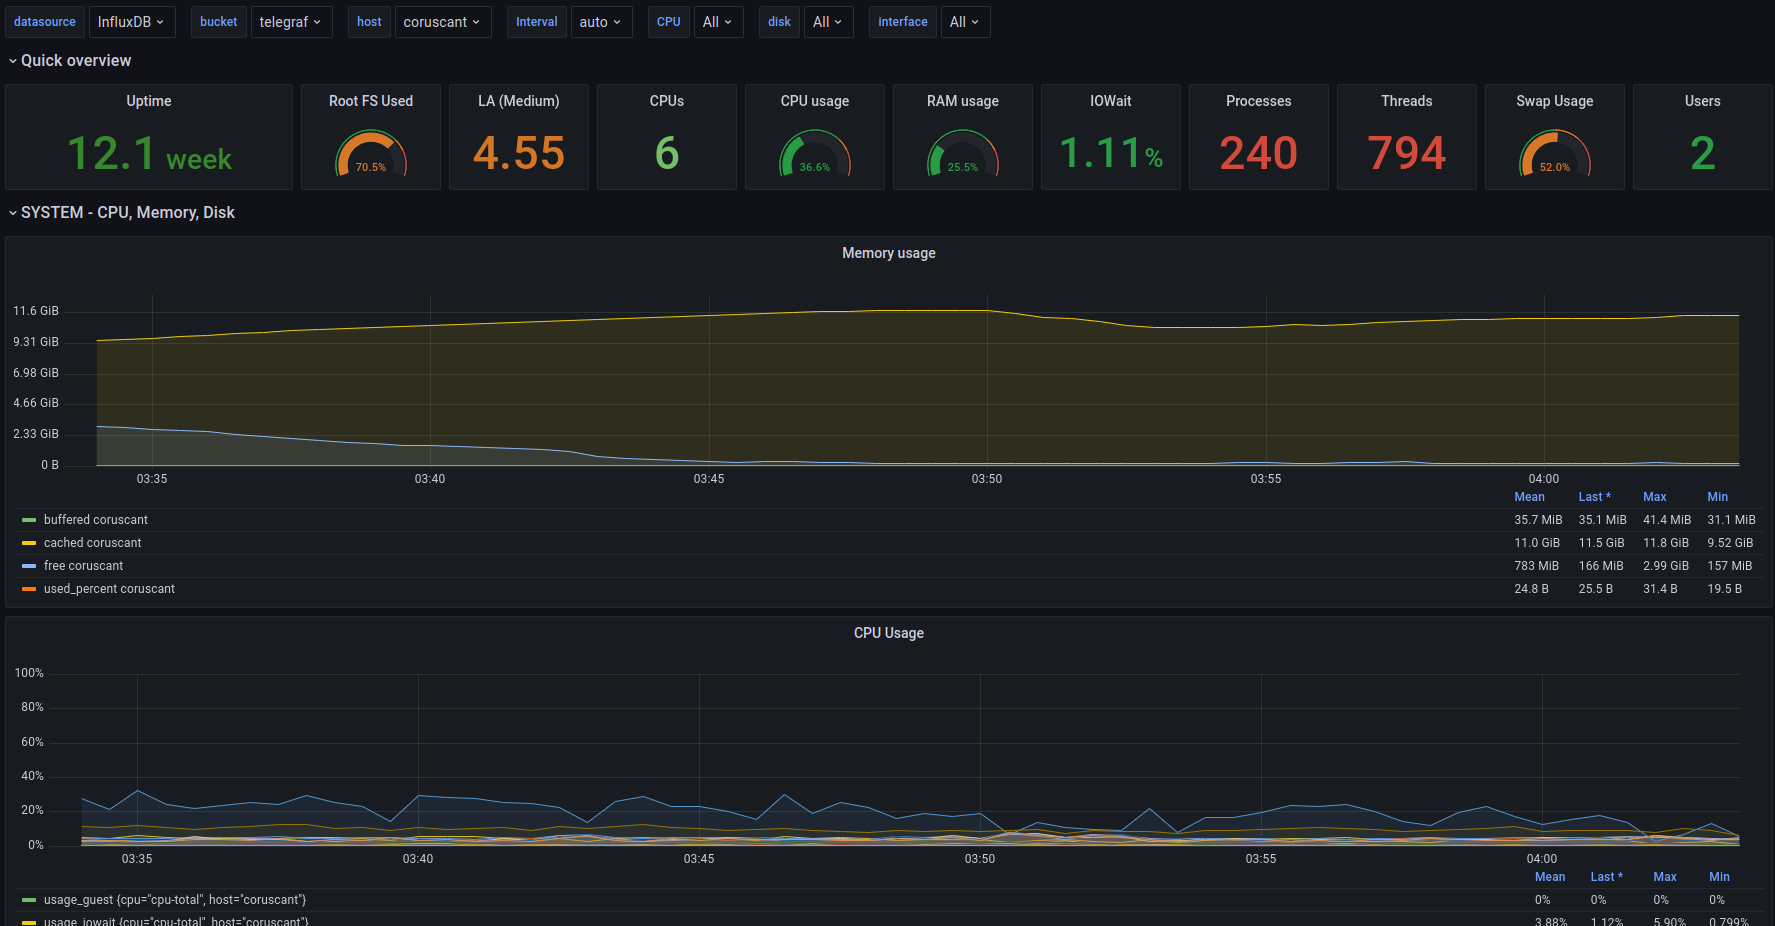
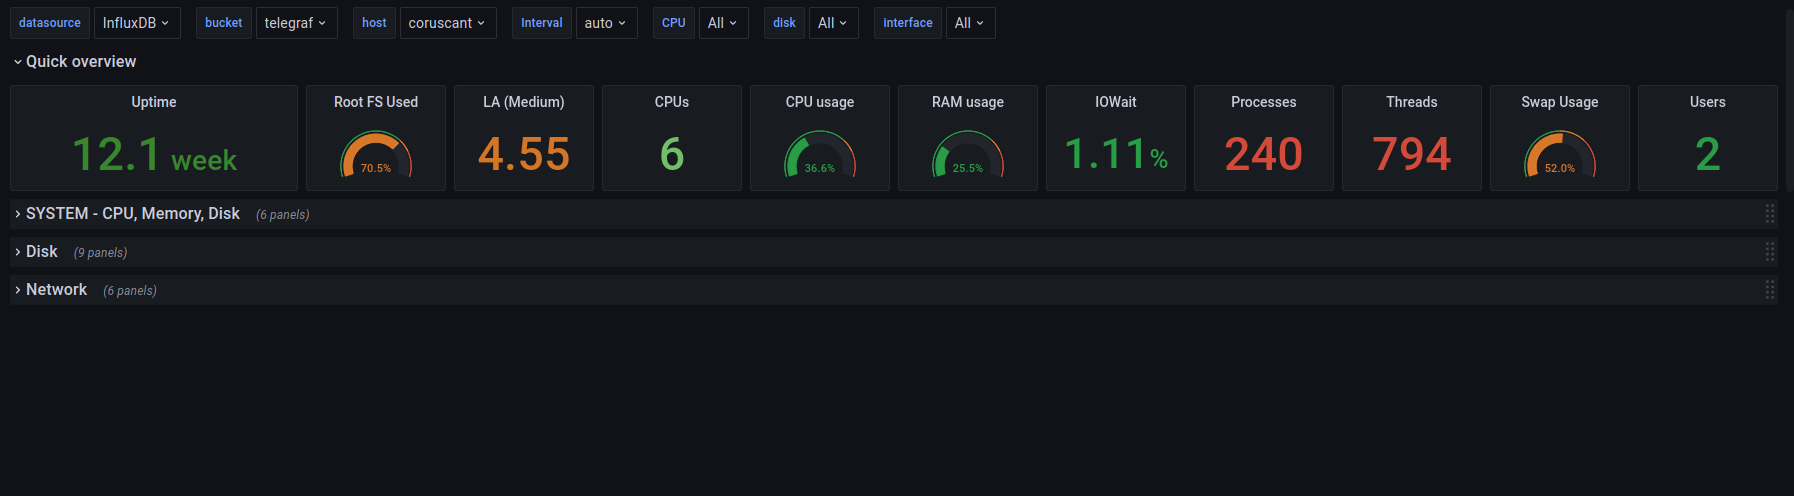
Dashboard show basic host metrics:
- CPU usage
- Disk usage
- Network usage
It shows only basic metrics collected by telegraf agent. Dashboard supports Flux query syntax.
Data source config
Collector type:
Collector plugins:
Collector config:
Revisions
Upload an updated version of an exported dashboard.json file from Grafana
| Revision | Description | Created | |
|---|---|---|---|
| Download |
InfluxDB
Easily monitor InfluxDB, an open source time series database, with Grafana Cloud's out-of-the-box monitoring solution.
Learn more