
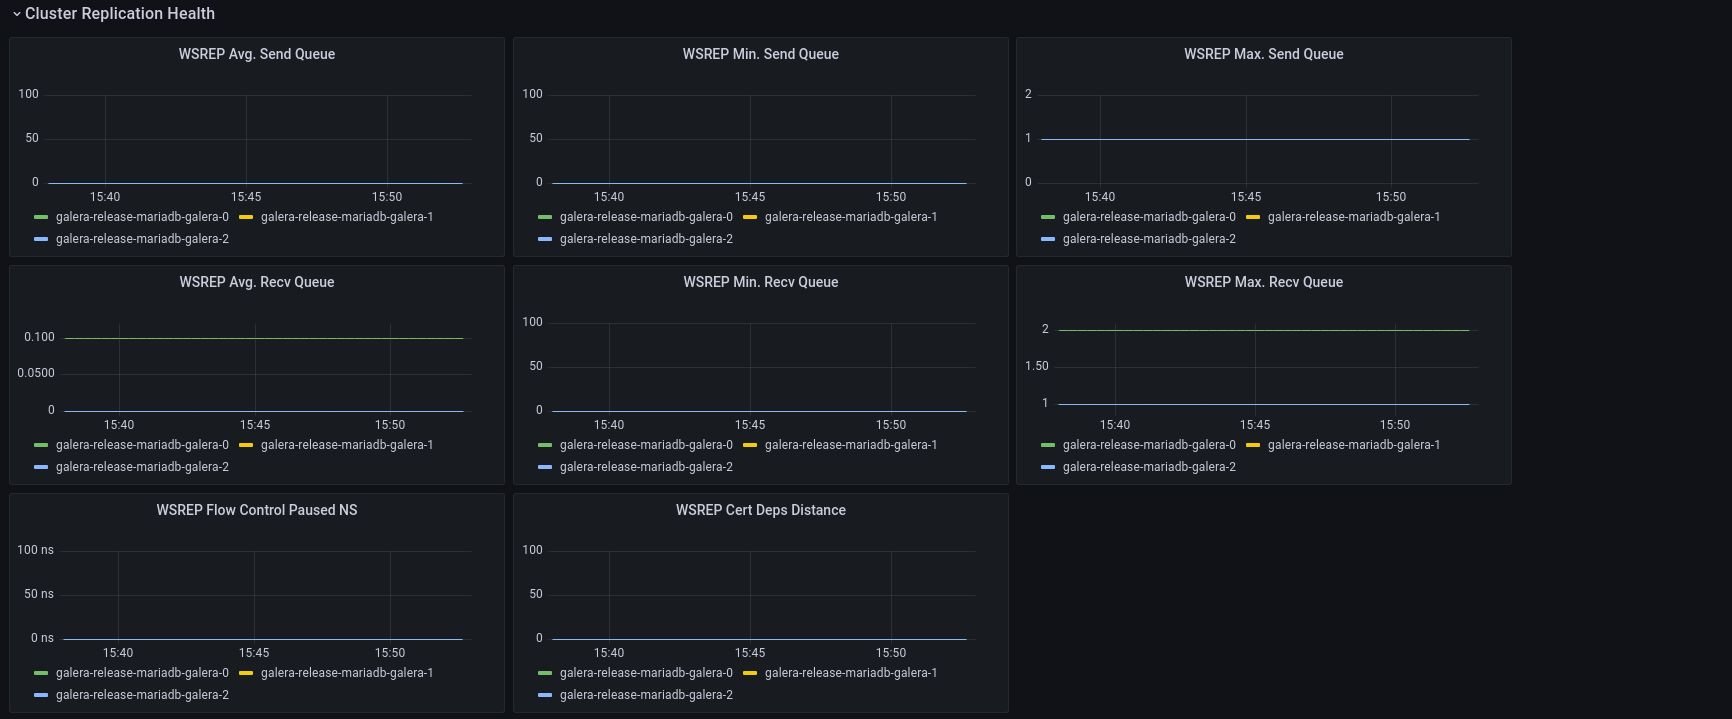
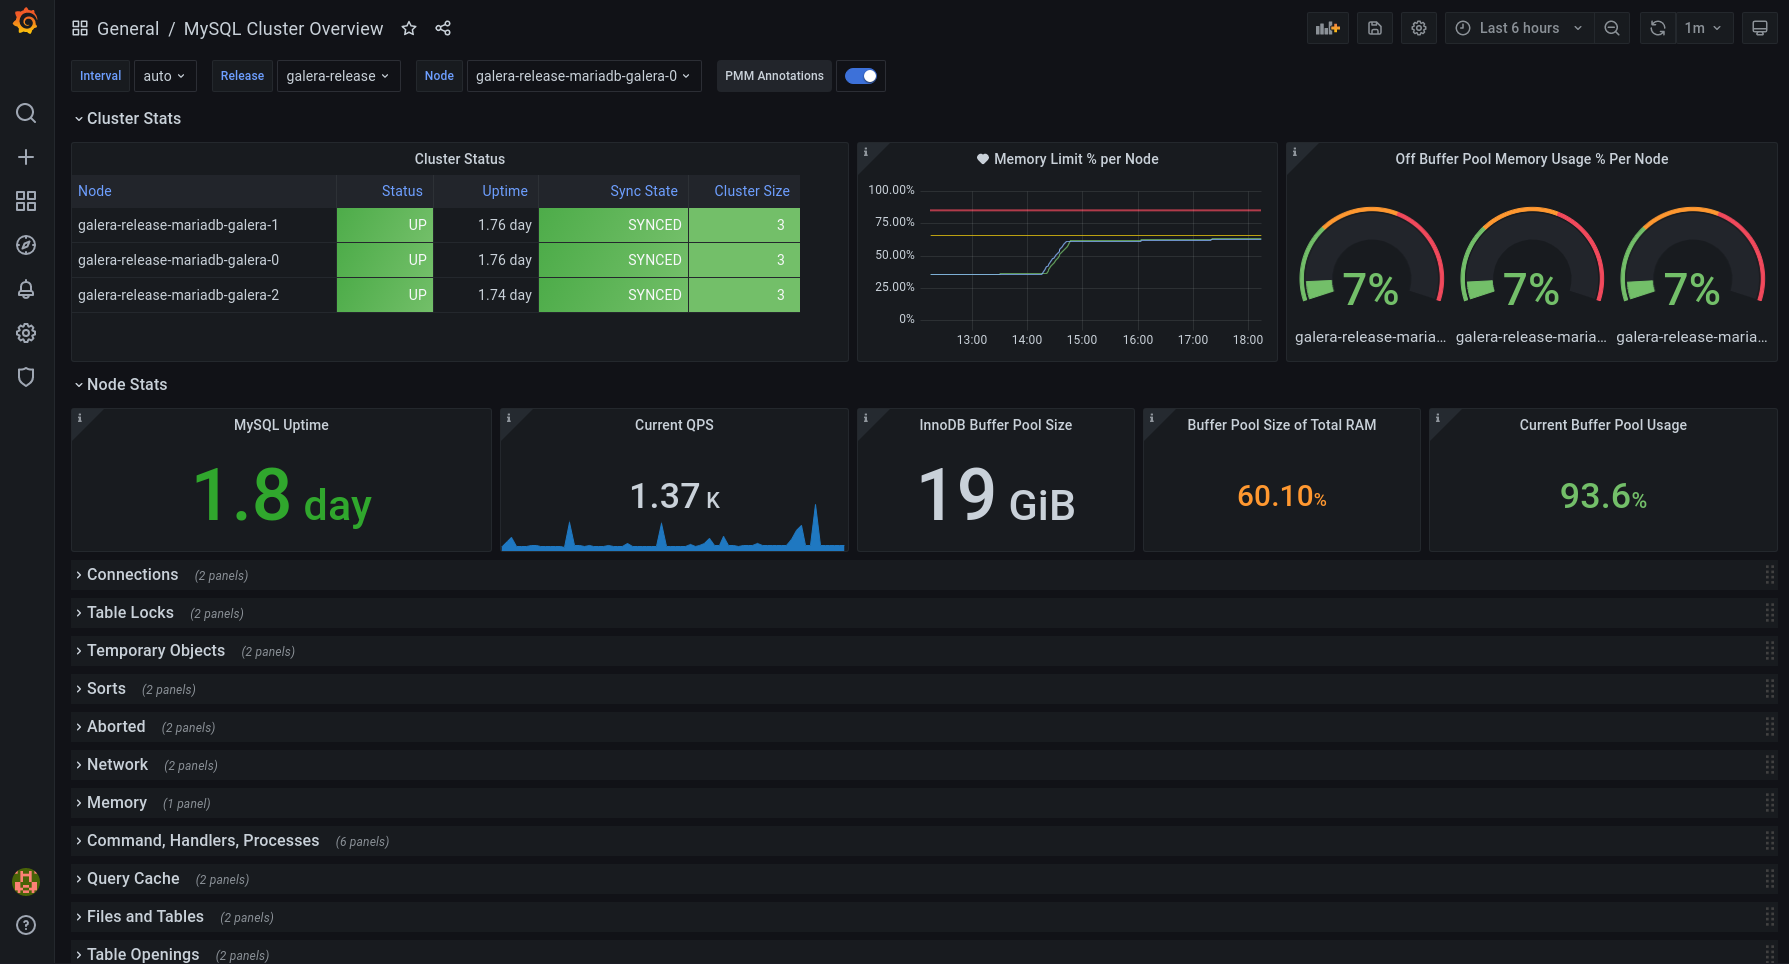
MySQL Cluster Overview
Dashboard for MySQL Galera Monitoring from prometheus mysql exporter.

Dashboard for MySQL Galera Monitoring from Bitnami MySQL exporter https://hub.docker.com/r/bitnami/mysqld-exporter/.
All the dashboard variables are templated based on a k8s based deployment, so they reference “Pod”, but this can changed to something else depending on your deployment. The important thing is that all the major metrics are there in the dashboard, along with a useful description in almost all the panels.
Adjusting these template variables - specifically “Release” should allow you to monitor any/all MySQL clusters that Prometheus is scraping.
Based off of a few other MySQL/Galera dashboads I’ve seen around, with a few extra panels added.
Happy monitoring!
Data source config
Collector config:
Dashboard revisions
Upload an updated version of an exported dashboard.json file from Grafana
| Revision | Decscription | Created | |
|---|---|---|---|
| Download |
Get this dashboard
Data source:
Dependencies: