Windows Node Exporter
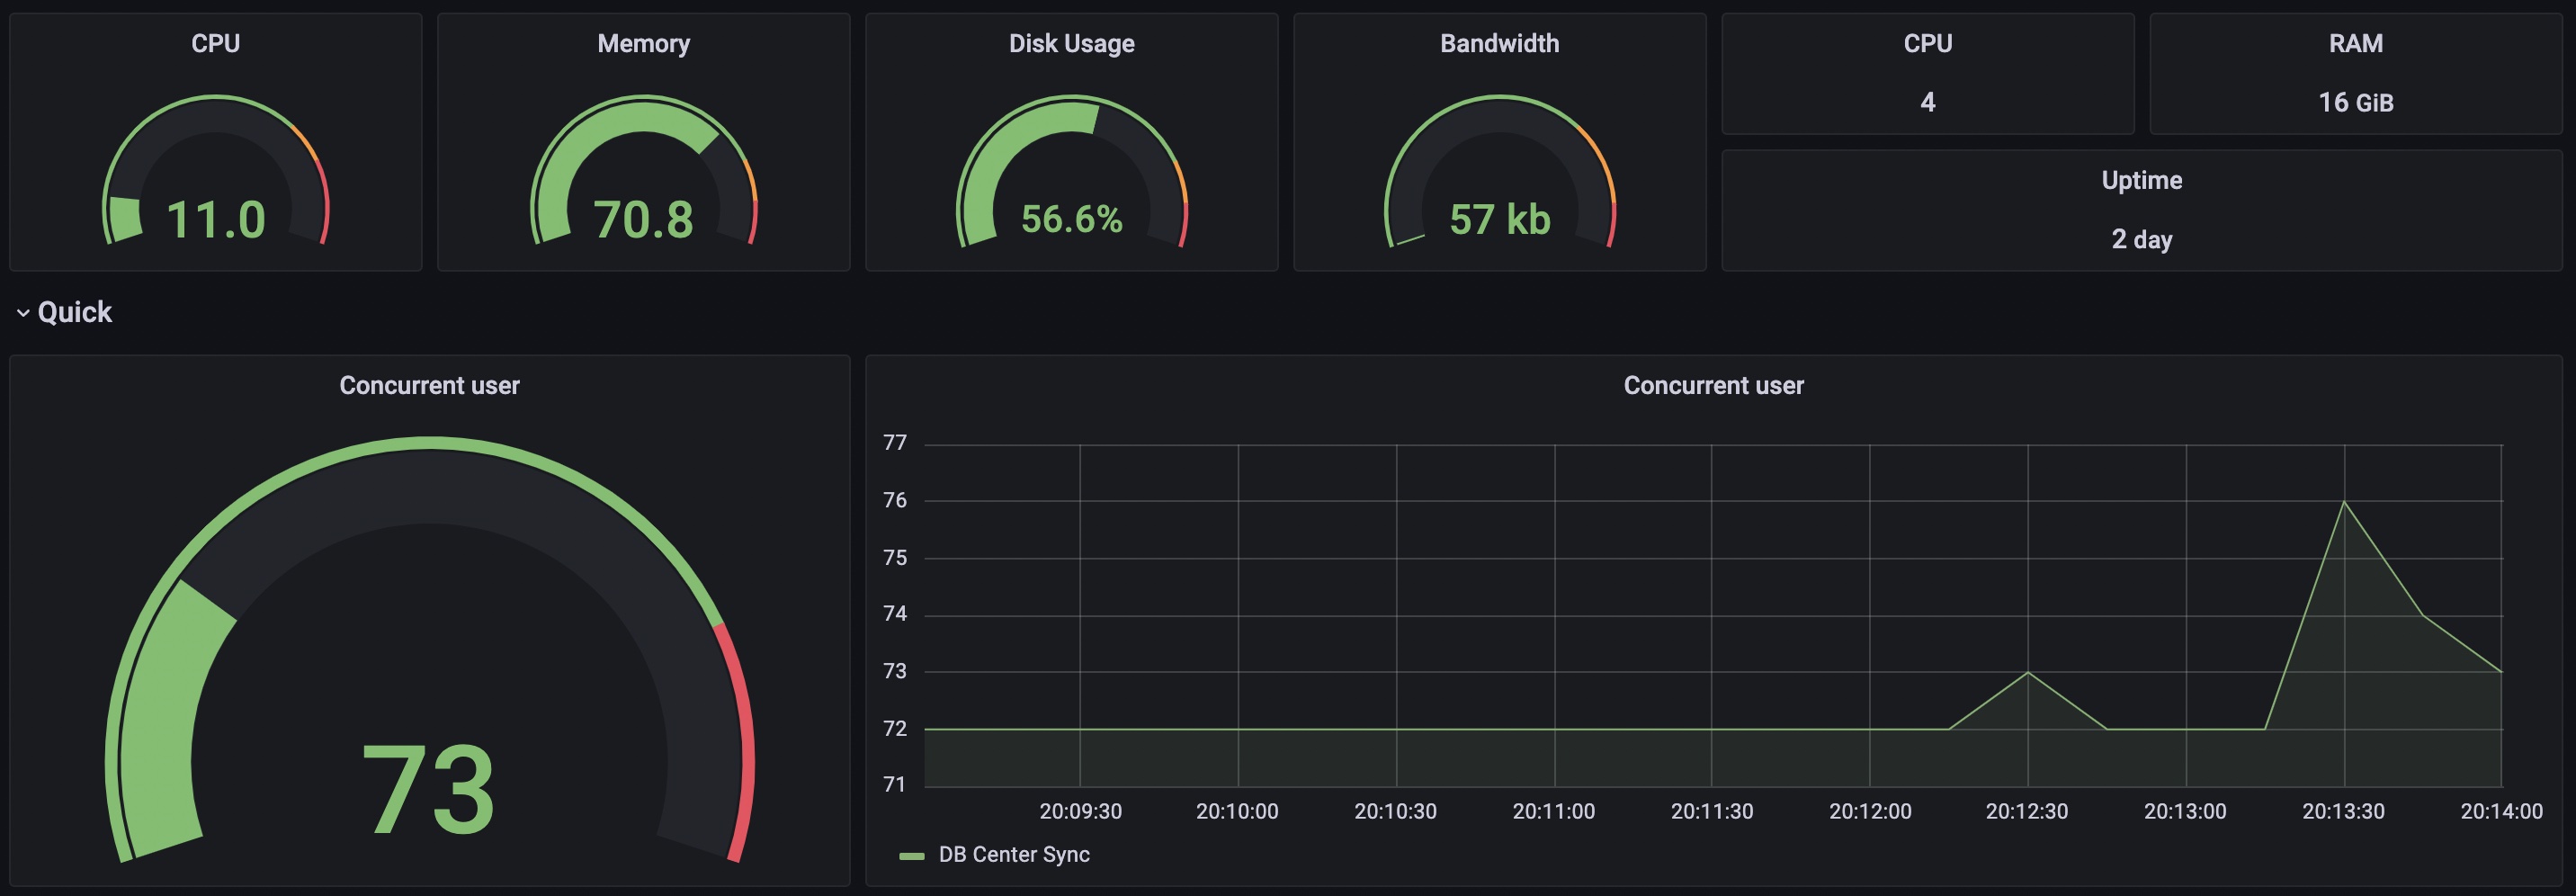
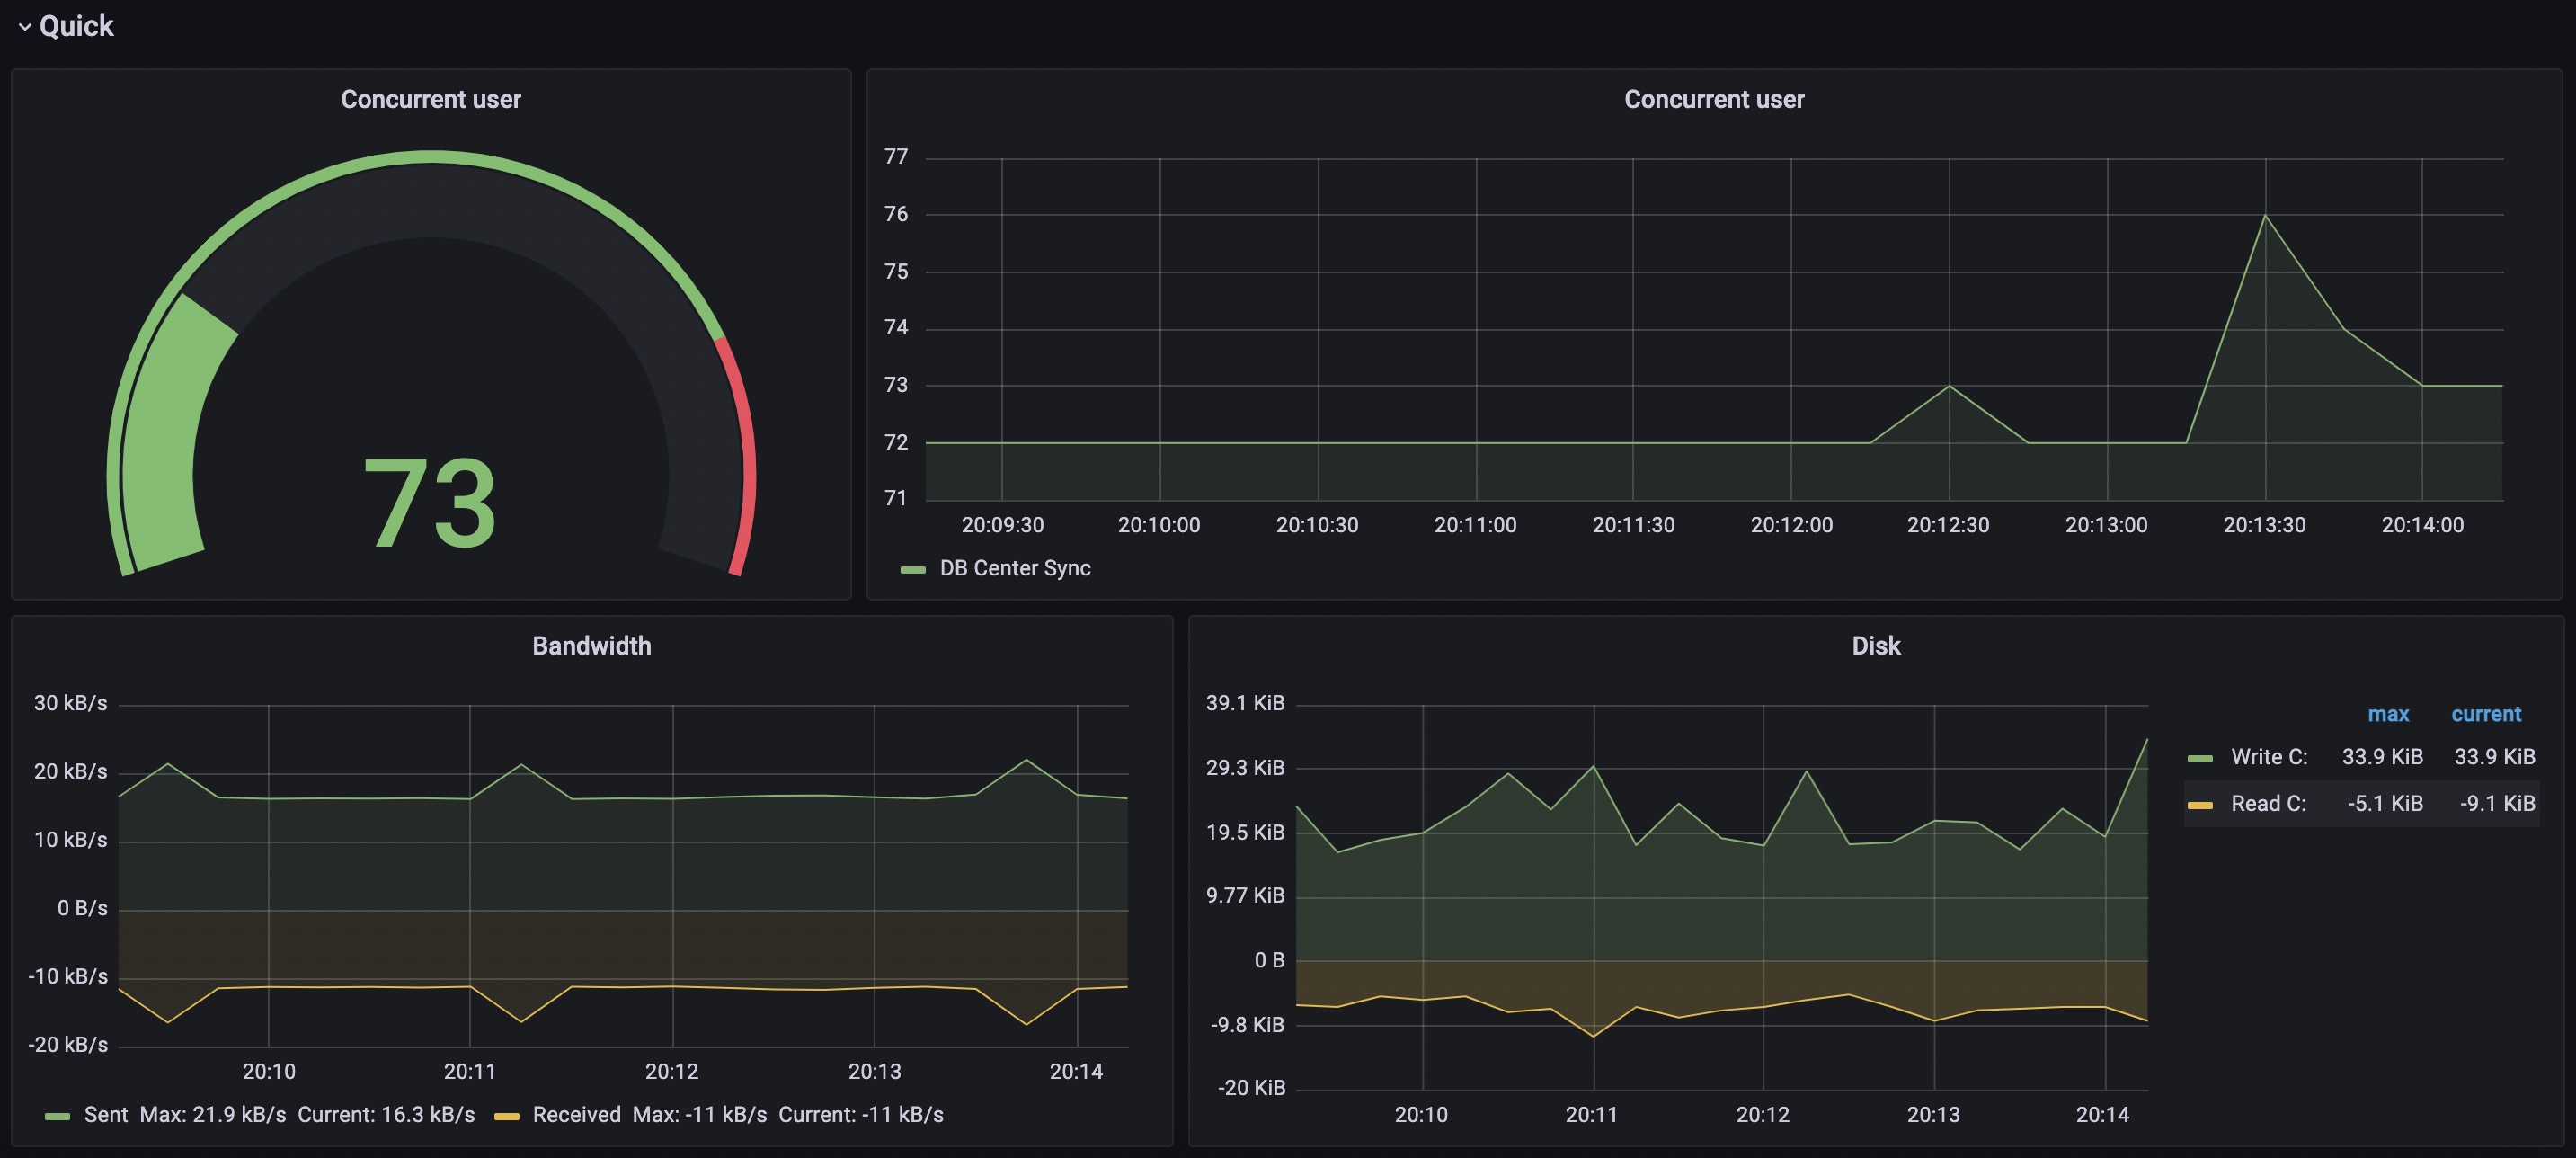
Use for analysis data that use for server performance testing
Prerequisites
How to install windows_exporter
After you download installer file. You can run command as below
msiexec /i windows_exporter-0.17.1-386.msi ENABLED_COLLECTORS="ad,adfs,cache,cpu,cpu_info,cs,container,dfsr,dhcp,dns,fsrmquota,logical_disk,logon,memory,msmq,mssql,netframework_clrexceptions,netframework_clrinterop,netframework_clrjit,netframework_clrloading,netframework_clrlocksandthreads,netframework_clrmemory,netframework_clrremoting,netframework_clrsecurity,net,os,process,remote_fx,service,tcp,time,vmware" TEXTFILE_DIR="C:\custom_metrics" LISTEN_PORT="9182"
when completes. Command will create service on Windows and you can look data that use "http://localhost:9182" and add IP and port to "promethus.yml" and then restart prometheus.
Data source config
Collector type:
Collector plugins:
Collector config:
Revisions
Upload an updated version of an exported dashboard.json file from Grafana
| Revision | Description | Created | |
|---|---|---|---|
| Download |
Linux Server
Monitor Linux with Grafana. Easily monitor your Linux deployment with Grafana Cloud's out-of-the-box monitoring solution.
Learn more