Unraid Dashboard
A Grafana dashboard for displaying Unraid stats
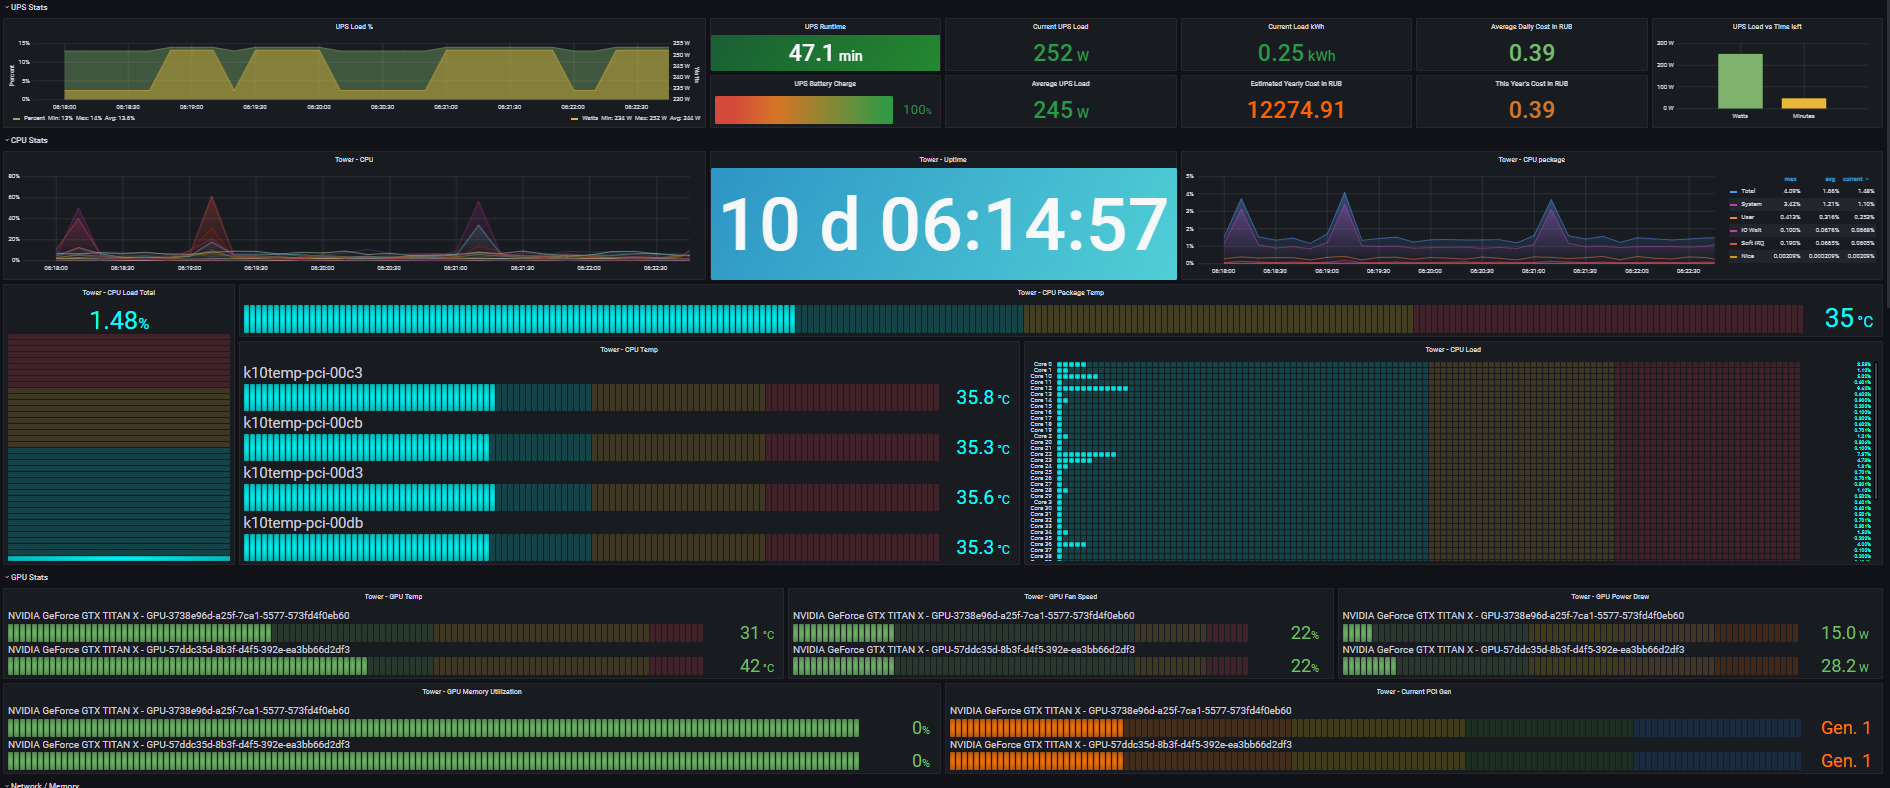
Grafana Dashboard to display your Unraid stats using Telegraf and InfluxDB2
This is a dashboard modified to support InfluxDB2 and is based on this dashboard made by gilbn
Enabling and working with nvidia-smi
In order to work with nvidia-smi, you need to launch Telegraf container with --runtime=nvidia Extra Argument
This however is not the last step, as to improve speed of querying data from your GPUs, you also need to create a custom user script which should be executed during the startup with the following content:
#!/bin/bash
nvidia-persistenced
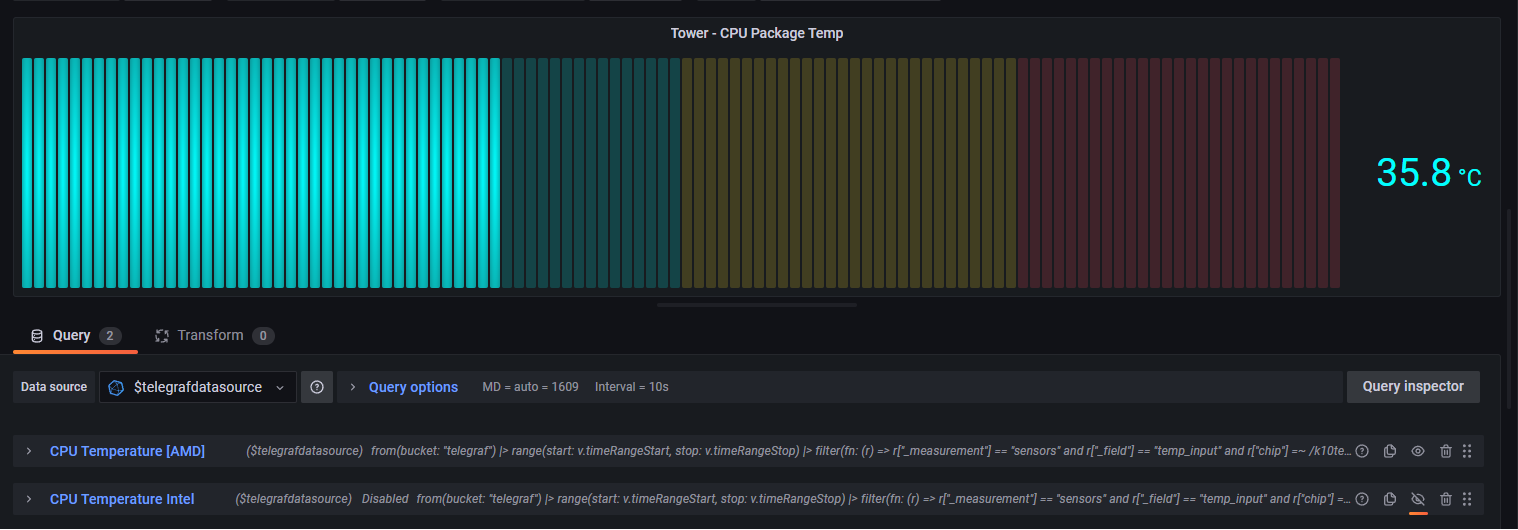
CPU Package Temp
This dashboard supports package temperature reporting for both Intel and AMD, you just need to hide one or another in the queries for the panel.
AMD query takes into account the "headroom" of 27 degrees given by AMD, so if system reports 68 degrees, the real temperature is 41 degrees.
P.S.
I am not the original author of this dashboard, i've just edited queries to support integration with InfluxDB 2.
The best thing you can do is to notify the original author about this one, so he can create a new version released under his name.
Data source config
Collector config:
Upload an updated version of an exported dashboard.json file from Grafana
| Revision | Description | Created | |
|---|---|---|---|
| Download |