Grafana Dashboard for Veeam Backup for Google Cloud Platform
Grafana Dashboard for Veeam Backup for Google Cloud Platform v2 - (Grafana 8.x / InfluxDB v2.x)
Just download the latest Veeam Backup for GCP script version from GitHub https://raw.githubusercontent.com/jorgedlcruz/veeam-backup-gcp-grafana/main/veeam_gcp.sh and change the Configuration section within your details:
# Configurations
##
# Endpoint URL for InfluxDB
##
veeamInfluxDBURL="http://YOURINFLUXSERVERIP" #Your InfluxDB Server, http://FQDN or https://FQDN if using SSL
veeamInfluxDBPort="8086" #Default Port
veeamInfluxDBBucket="veeam" # InfluxDB bucket name (not ID)
veeamInfluxDBToken="TOKEN" # InfluxDB access token with read/write privileges for the bucket
veeamInfluxDBOrg="ORG NAME" # InfluxDB organisation name (not ID)
Endpoint URL for login action
veeamUsername="YOURVEEAMBACKUPUSER"
veeamPassword="YOURVEEAMBACKUPPASS"
veeamBackupGCPServer="https://YOURVEEAMBACKUPFORGCPIP"
veeamBackupGCPPort="13140" #Default Port
Once the changes are done, make the script executable with chmod:
chmod +x veeam_gcp.sh
The output of the command should be something like the next, without errors:
Writing veeam_gcp_sessions Policy to InfluxDB
HTTP/2 204
x-influxdb-build: OSS
x-influxdb-version: 2.1.1
date: Wed, 15 Dec 2021 16:14:56 GMT
If so, please now add this script to your crontab, like for example every 30 minutes:
*/30 * * * * /home/oper/veeam_gcp.sh >> /var/log/veeamgcp.log 2>&1
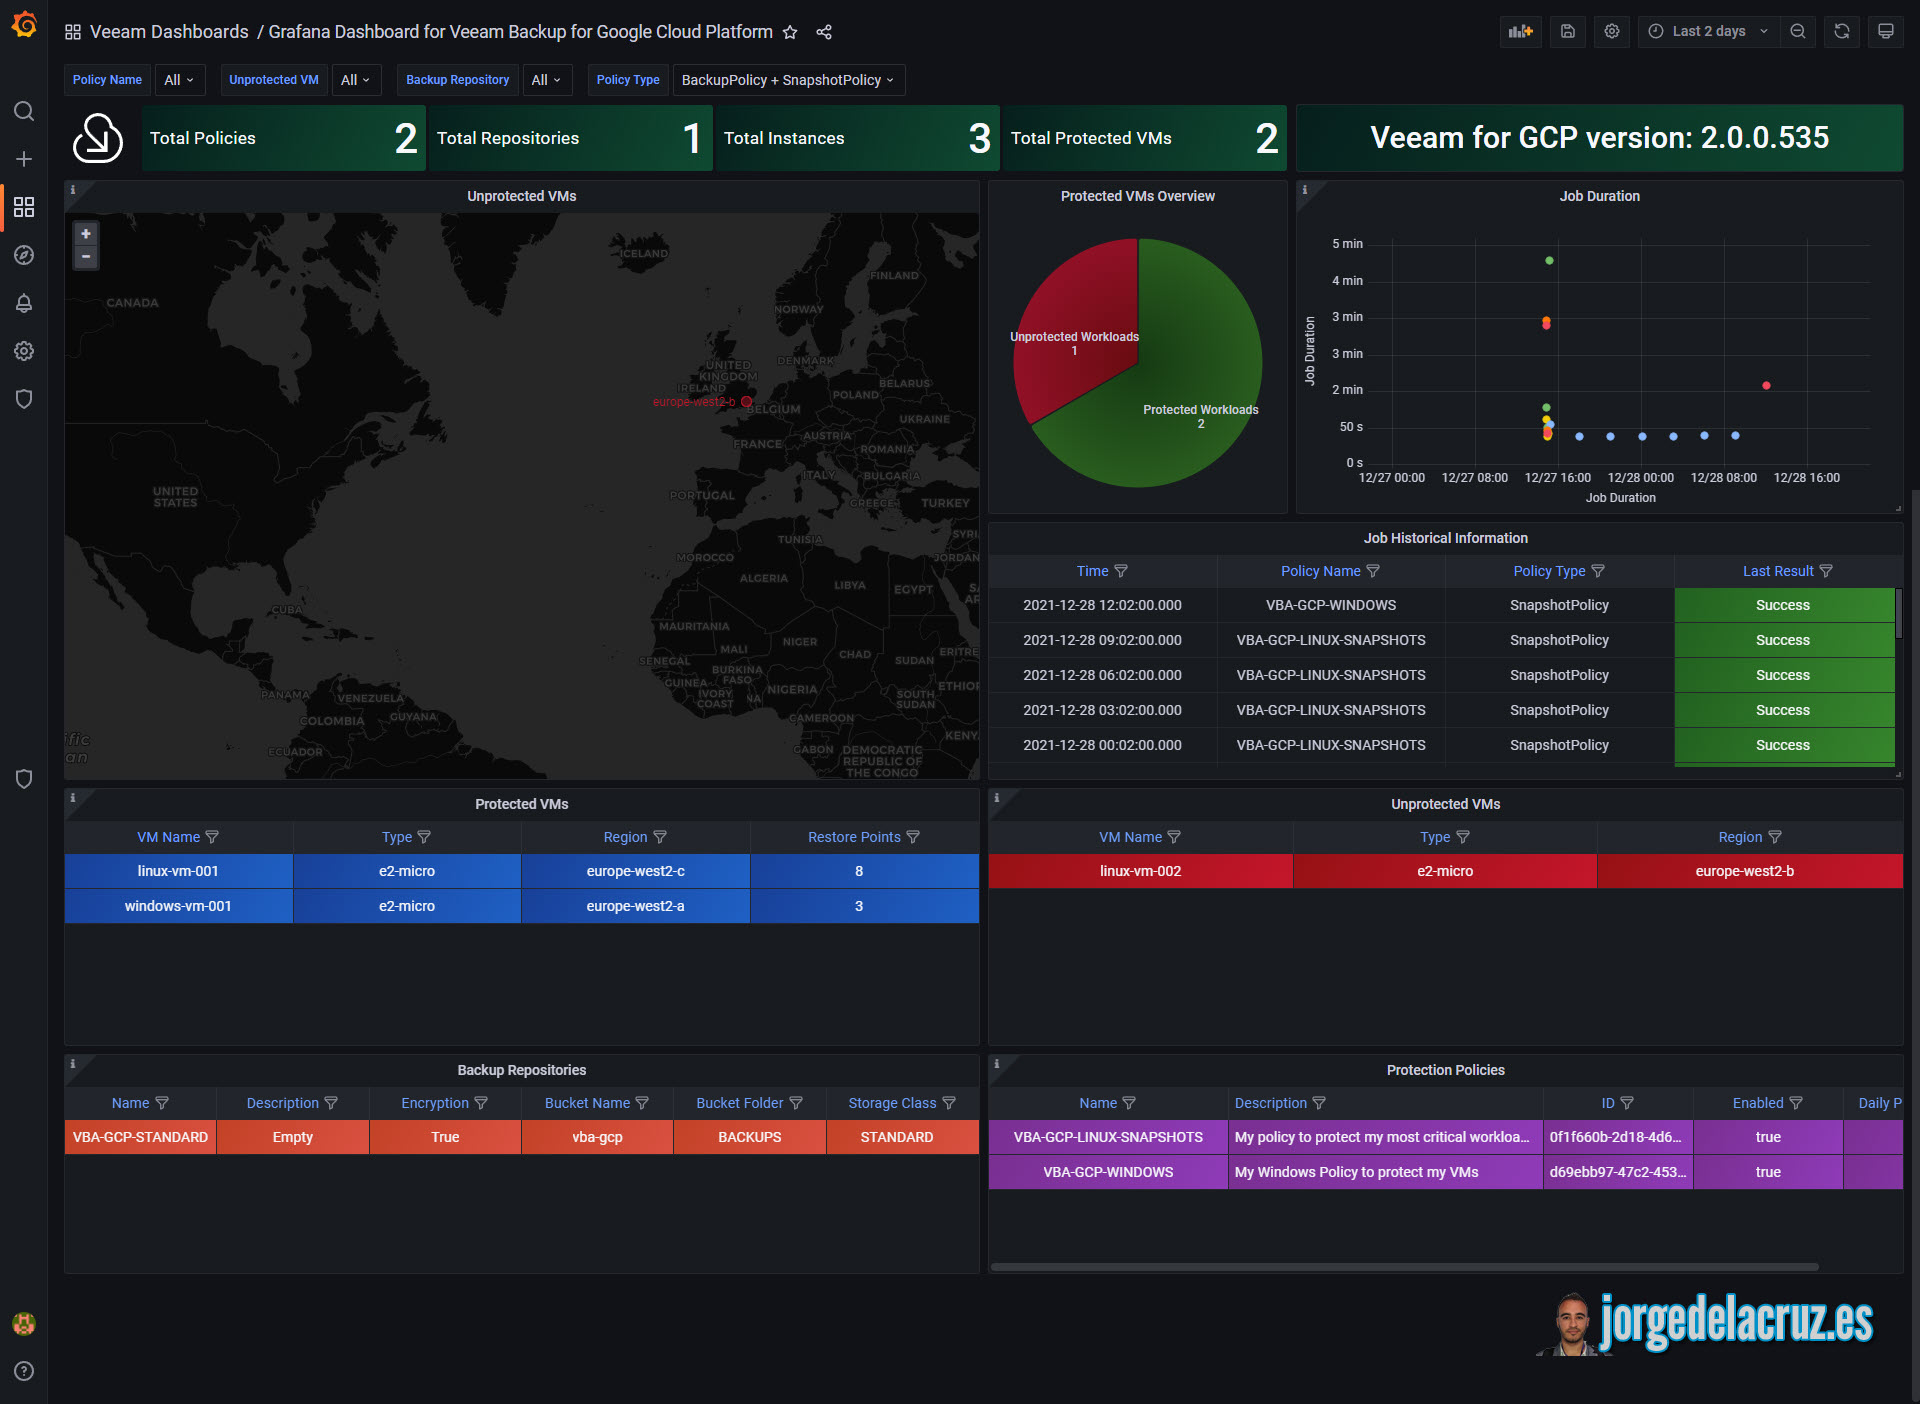
Then download or import this Dashboard to your Grafana, and you should see something similar to the next:

Data source config
Collector config:
Upload an updated version of an exported dashboard.json file from Grafana
| Revision | Description | Created | |
|---|---|---|---|
| Download |
Google Cloud Observability with Grafana Cloud
Easily visualize and alert on Google Cloud Service resources using the fully managed Grafana Cloud platform.
Learn more