k8s-argo-rollout
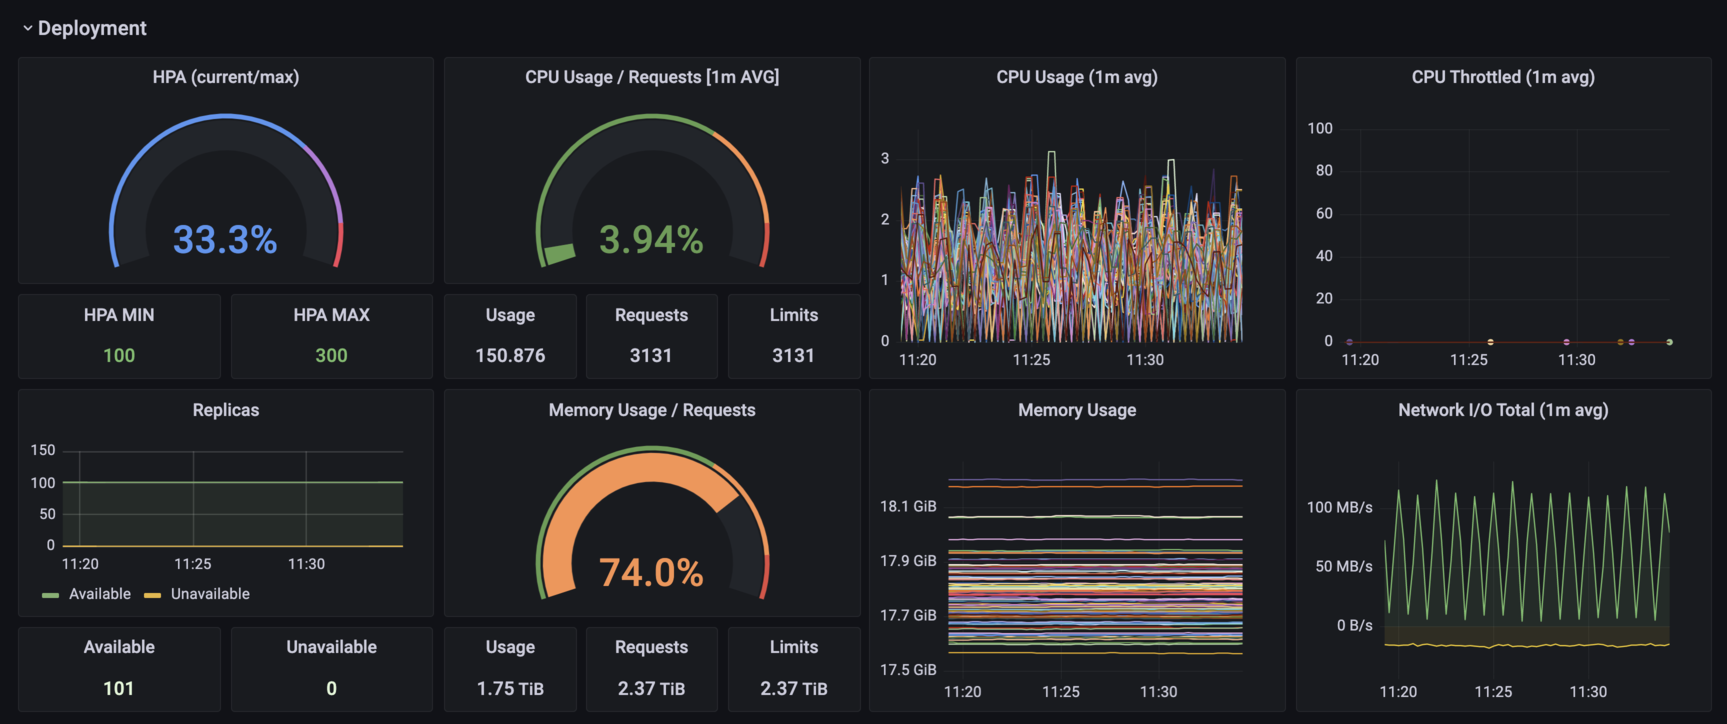
Dashboard for Kubernetes Deployment with Prometheus.
Kubernetes with Argo rollout monitoring dashboard.
Notificaiton
- New version has released. (2022-03-29)
- Revision 4: Redis Enter + Argo rollout
- Revision 5: Argo rollout + Istio
Introduction
- Author: KAMO (Bread.kim82, Louis.0802, June.bee)
- Organization: kakaomobility
Description
Dashboard: referring to dashboard 9679, recreated it for argo rollout monitoring. Kubernetes with Argo rollout.
- Pods information on your cluster.
- Container Resource Request && Limit status. (per cluster, per namespace)
- Rollout metrics info (per cluster, rollout, namespace.)
Information
0. install prometheus and grafana with kube-prometheus-stack (helm)
-
Use kube-state-metrics exporter to get metrics of deployed resources.
(memories, cpu utilization… etc)
-
Use Argo-rollout exporter to get rollout metrics. (name, replicas, etc)
You should configure annotations for metrics in Argo-rollout.
commit
211214 (~Revision 4)
- add cpu and memory usages per container.
- add variables for redis, add redis monitoring graphs (only for redis-enterprise) -> use prometheus scrape option.
220329 (Revision 5)
- remove Redis Enterprise Monitoring
- Make it simpler and easier to set (remove variables)
- Setting for ASM Istio + Argo rollout (You need to edit some variables if you want to use istio monitoring)
Data source config
Collector config:
Upload an updated version of an exported dashboard.json file from Grafana
| Revision | Description | Created | |
|---|---|---|---|
| Download |
Kubernetes
Monitor your Kubernetes deployment with prebuilt visualizations that allow you to drill down from a high-level cluster overview to pod-specific details in minutes.
Learn more
