
Goldshell-MiniDOGE
Grafana Dashboard to monitor GoldShell Miners
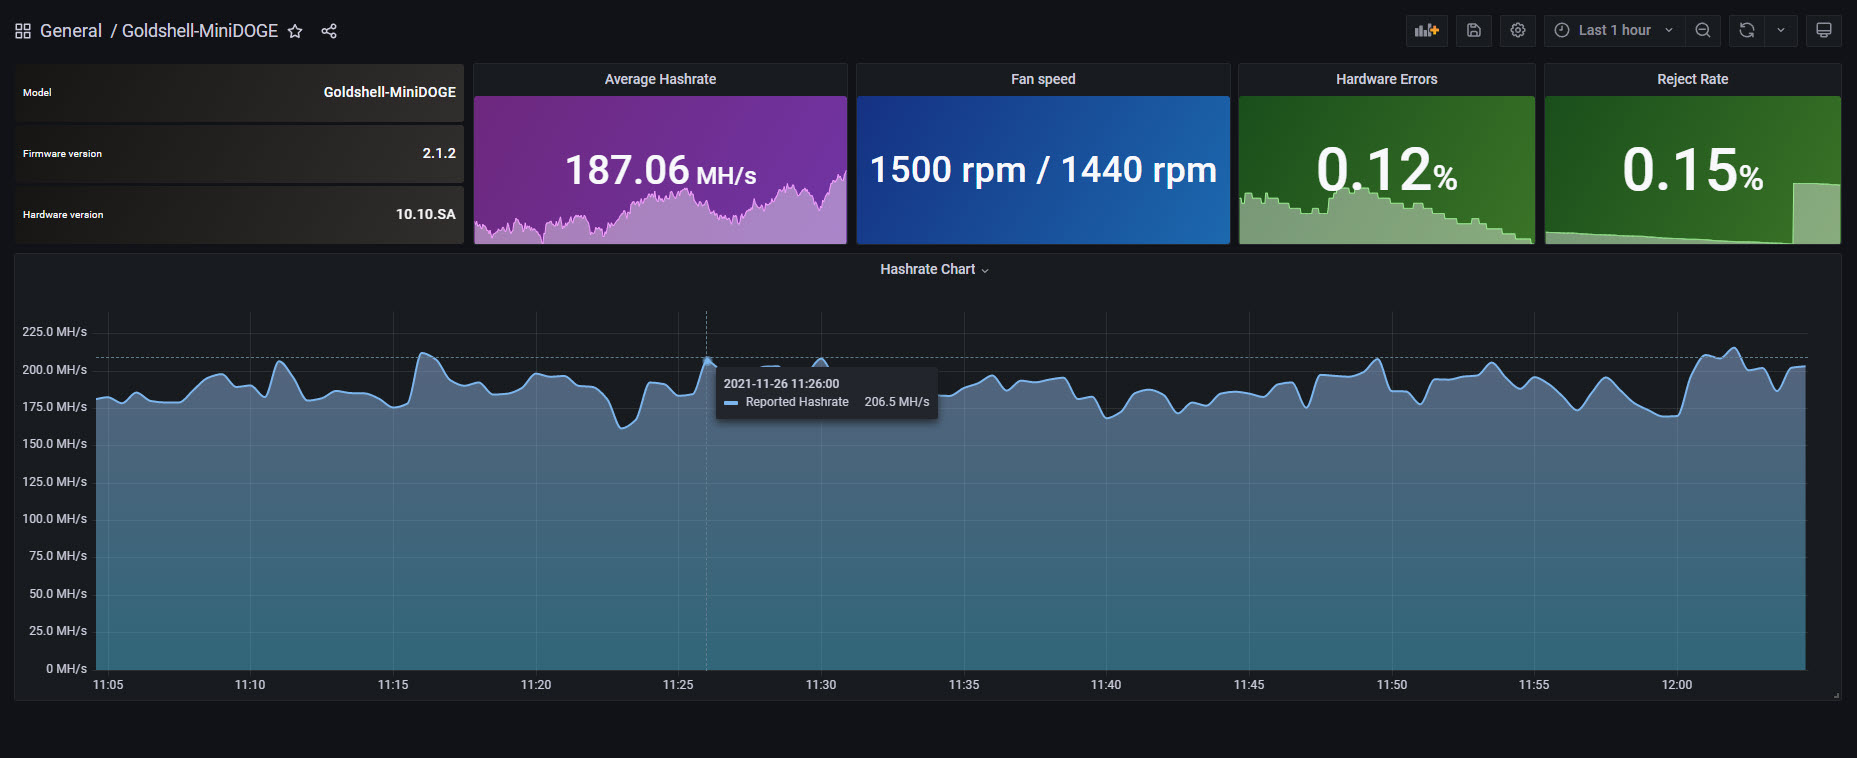
Grafana Dashboard for Goldshell Miner

This project queries the public, and available Goldshell API, based on cgminer, to obtain useful data about our ASIC Miner, using native telegraf, sending the data to InfluxDB, and finally showing it on Grafana.
No Scripting is required
Getting started
You can follow the steps on the next Blog Post - TBD
Or try with this simple steps:
- Create a new config file called goldshell.conf under /etc/telegraf/telegraf.d/ directory
- Add the next configuration to it, chaning the IP with your valid Goldshell IP or FQDN
[[inputs.http]]
    urls = ["http://YOURGOLDSHELLIP/mcb/cgminer?cgminercmd=devs"]
    data_format = "json_v2"
        [[inputs.http.json_v2]]
            measurement_name = "goldshell_stats"
        [[inputs.http.json_v2.object]]
            path = "data"


[[inputs.http]]
    urls = ["http://YOURGOLDSHELLIP/mcb/status"]
    data_format = "json_v2"
        [[inputs.http.json_v2]]
            measurement_name = "goldshell_stats"

            [[inputs.http.json_v2.field]]
                path = "hardware"

            [[inputs.http.json_v2.field]]
                path = "model"

            [[inputs.http.json_v2.field]]
path = "firmware" - Save the file, and restart telegraf service
service telegraf restart
- Download the Goldshell Grafana Dashboard JSON file and import it into your Grafana
- Enjoy :)
Additional Information
- Nothing to add as of today
Known issues
Would love to see some known issues and keep opening and closing as soon as I have feedback from you guys. Fork this project, use it and please provide feedback.
Data source config
Collector type:
Collector plugins:
Collector config:
Dashboard revisions
Upload an updated version of an exported dashboard.json file from Grafana
| Revision | Decscription | Created | |
|---|---|---|---|
| Download |
Sign up for Grafana Cloud

Get up and running in minutes with the Grafana Cloud free tier, which includes free forever 10k metrics, 50GB logs, 50GB traces, 500 VUh, and more.
Get this dashboard
Data source:
Dependencies: