MongoDB Monitoring Dashboard
Dashboard for MongoDB server statistics metrics collected by Telegraf agent.
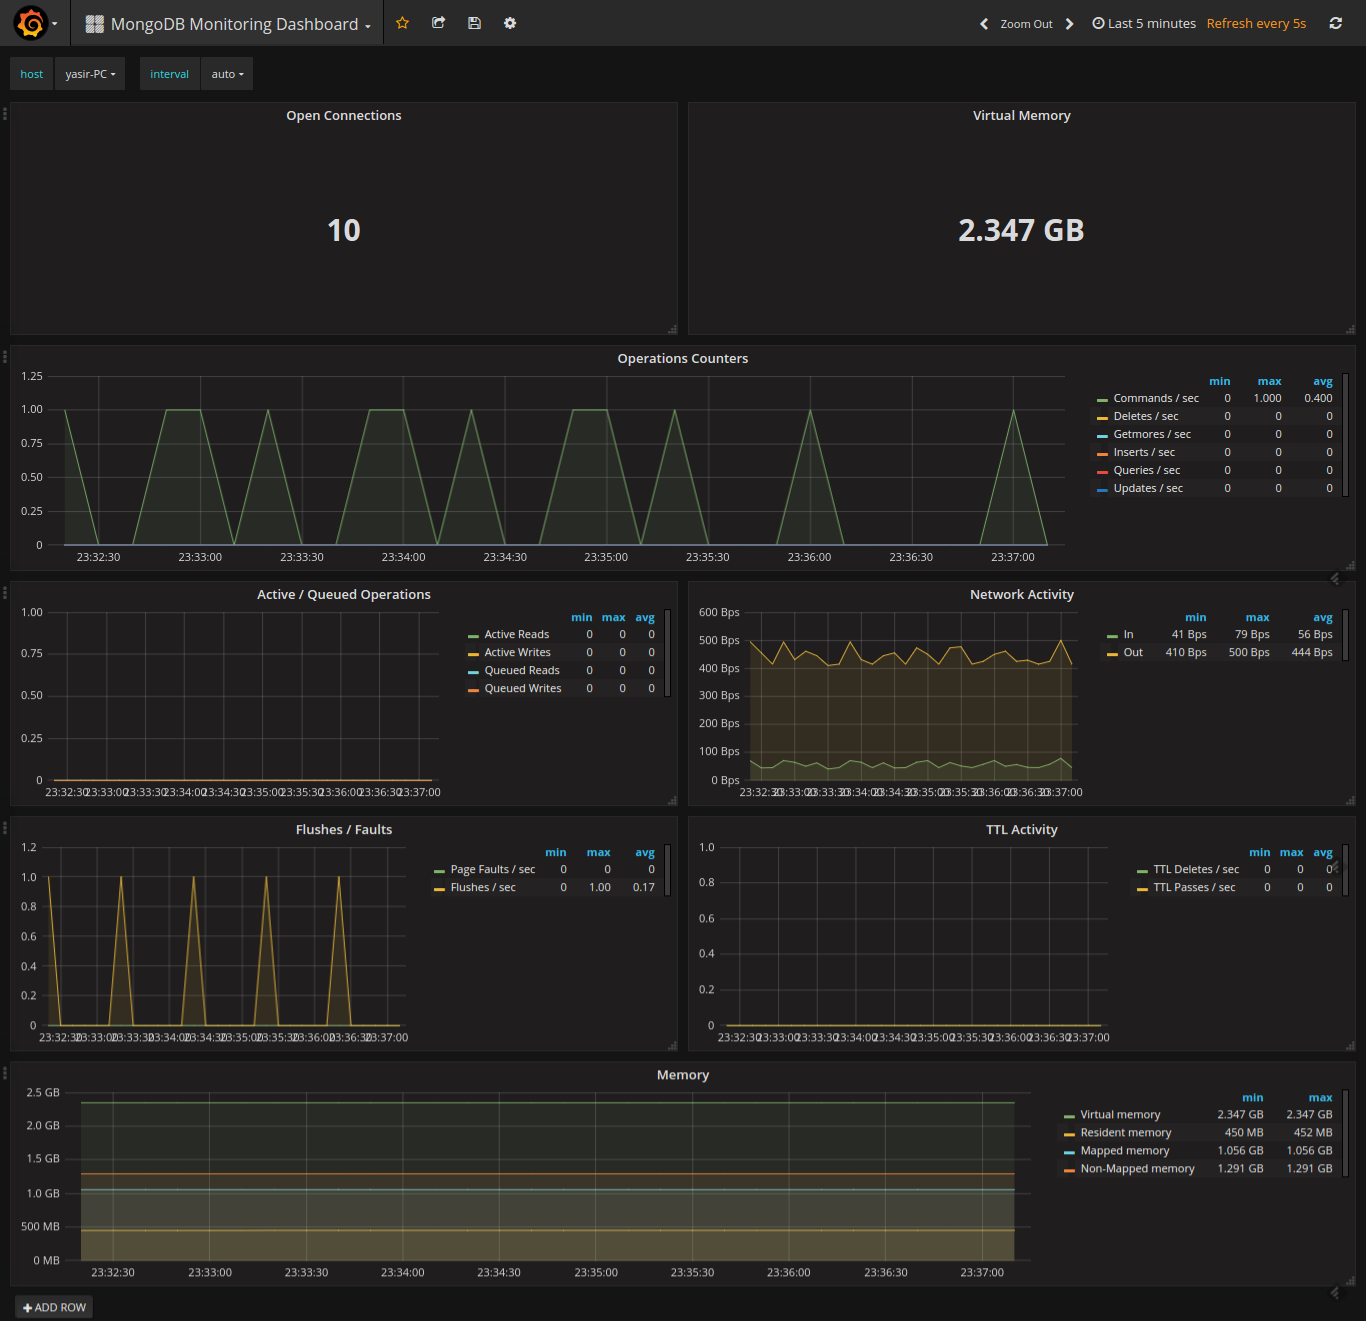
This dashboard shows all the metrics collected by Telegraf from server statistics of MongoDB.
Data source config
Collector type:
Collector plugins:
Collector config:
Revisions
Upload an updated version of an exported dashboard.json file from Grafana
| Revision | Description | Created | |
|---|---|---|---|
| Download |
MongoDB
Easily monitor MongoDB, a general purpose, document-based, distributed database, with Grafana Cloud's out-of-the-box monitoring solution.
Learn more