Prometheus Network Exporter
Prometheus Network Exporter
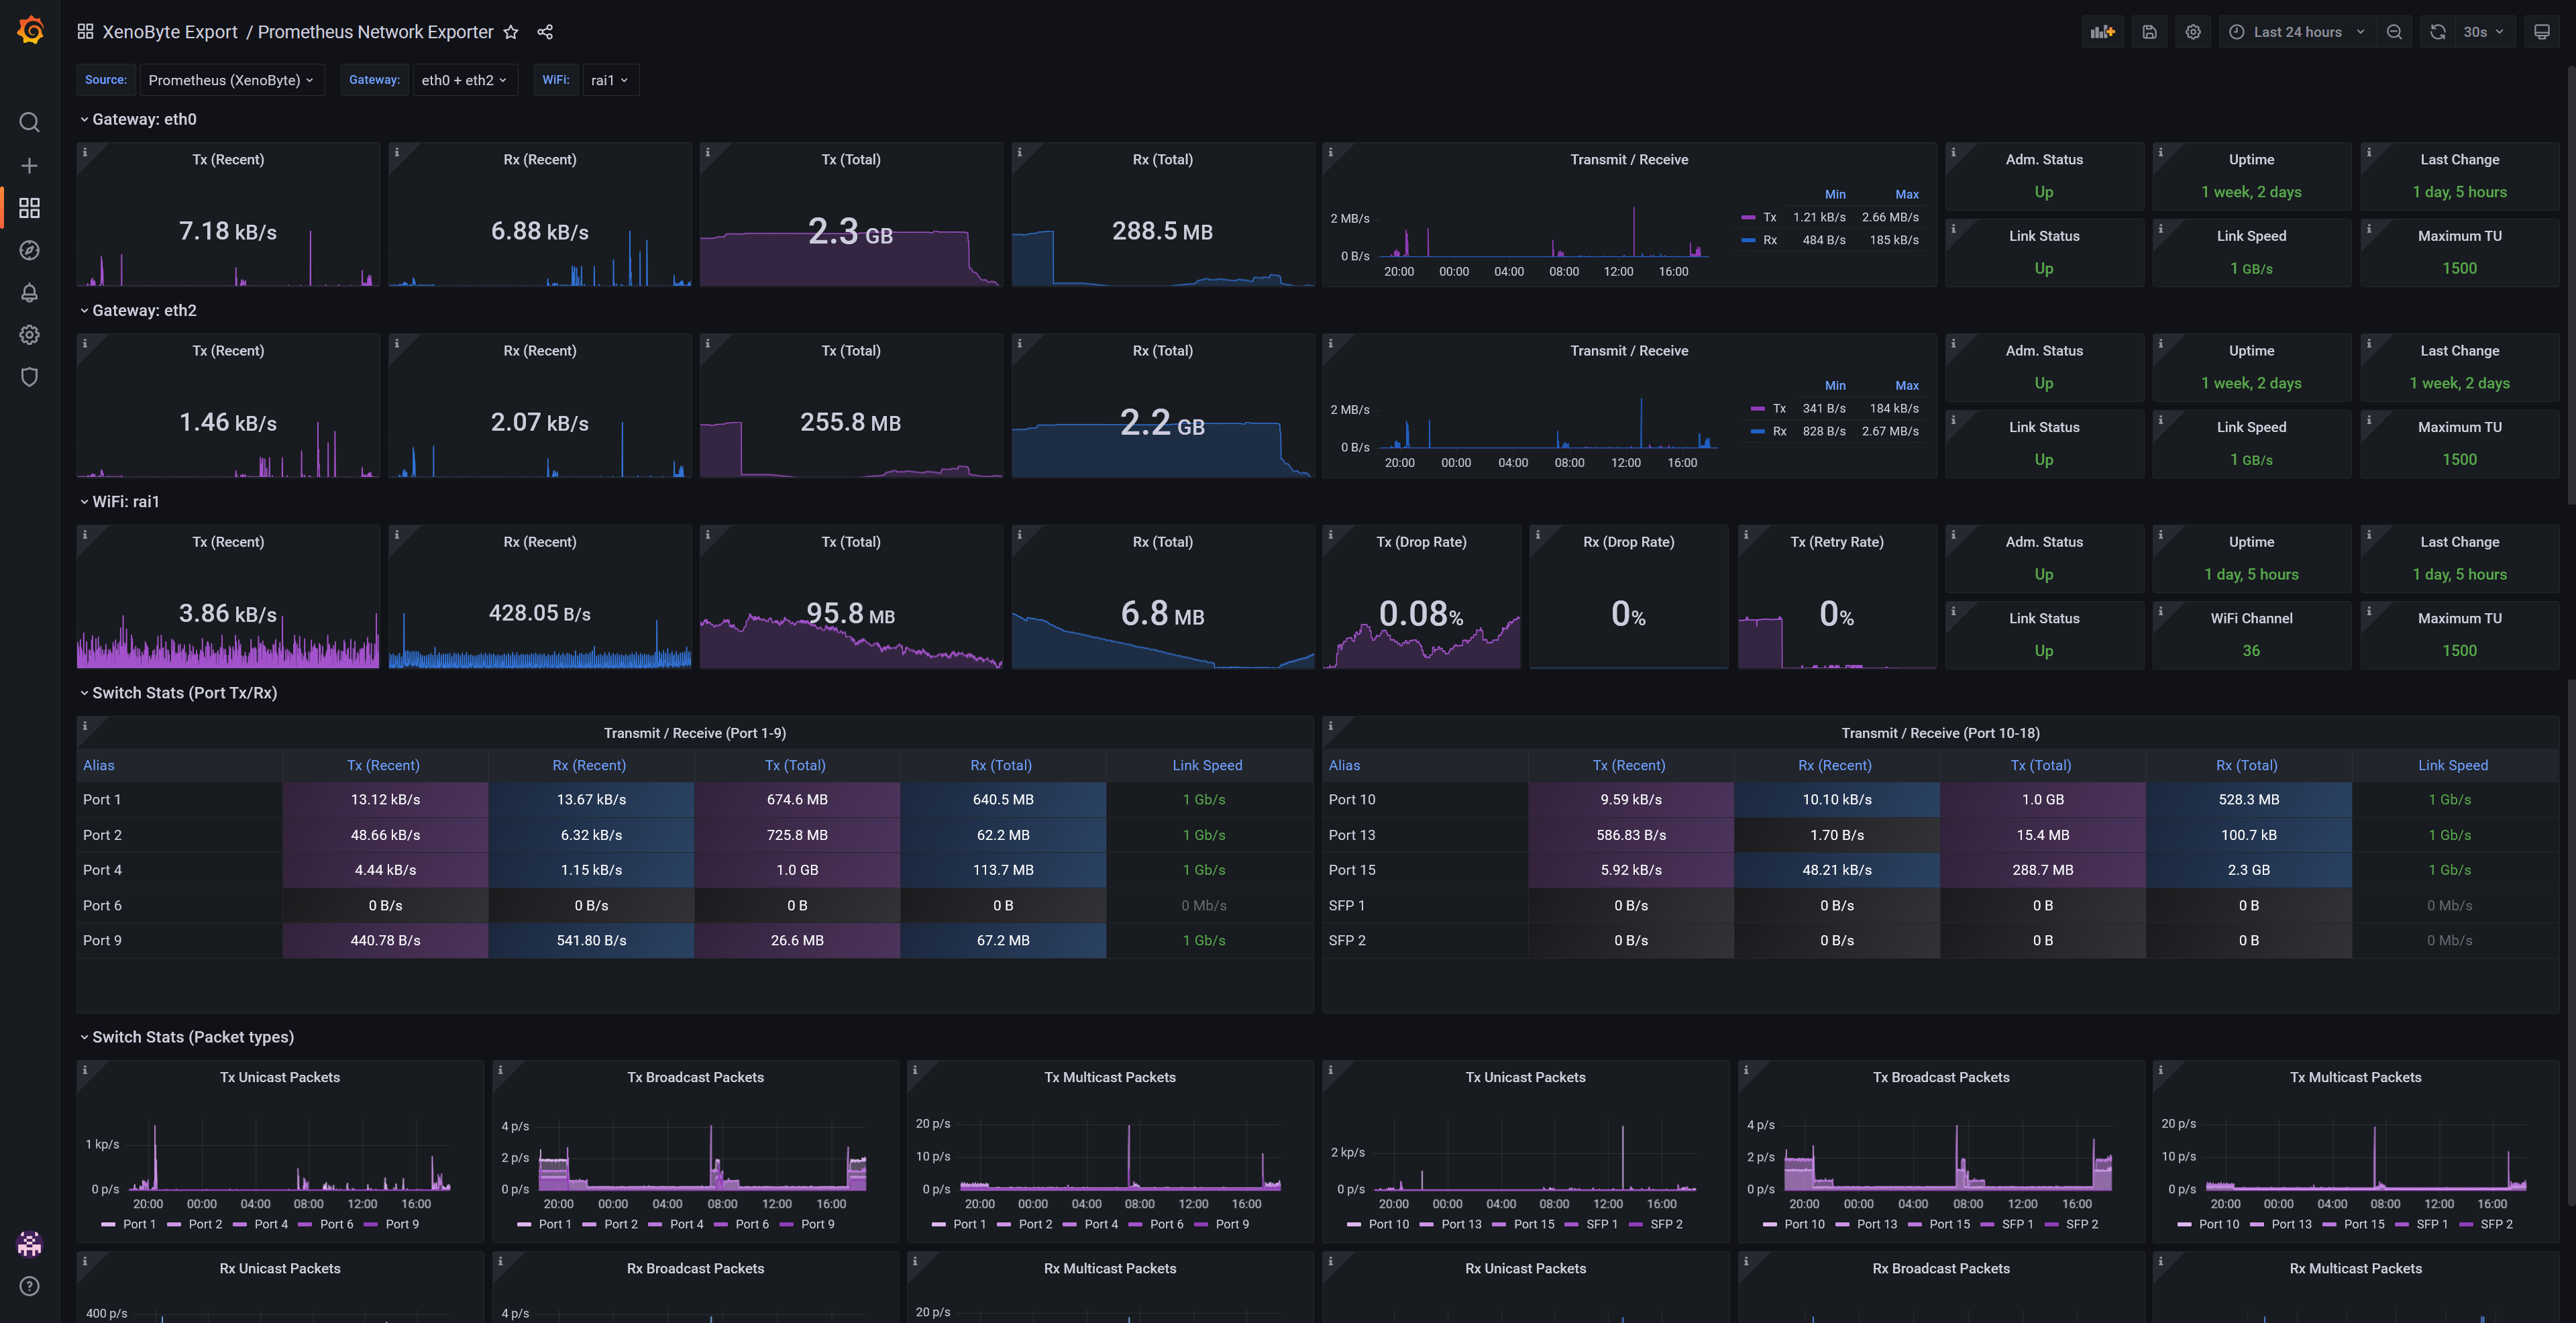
This dashboard gives an overview of Port/WiFi data for your Gateway and Access Points, including:
- Transmit / Receive
- Uptime
- Link status and speed
- Drop rate and retry (Unifi WiFi)
As well as detailed switch stats for each port, including Unicast, Broadcast and Multicast packets.
Uses Prometheus with the following exporters:
- SNMP Exporter
With Grafana variables/constants, you can easily add:
- More gateway and switch ports
- More radios/Wifi networks
Data source config
Collector type:
Collector plugins:
Collector config:
Revisions
Upload an updated version of an exported dashboard.json file from Grafana
| Revision | Description | Created | |
|---|---|---|---|
| Download |
Metrics Endpoint (Prometheus)
Easily monitor any Prometheus-compatible and publicly accessible metrics URL with Grafana Cloud's out-of-the-box monitoring solution.
Learn more