Melroy's Status Dashboard
Melroy's Server Status Uptime metrics page.
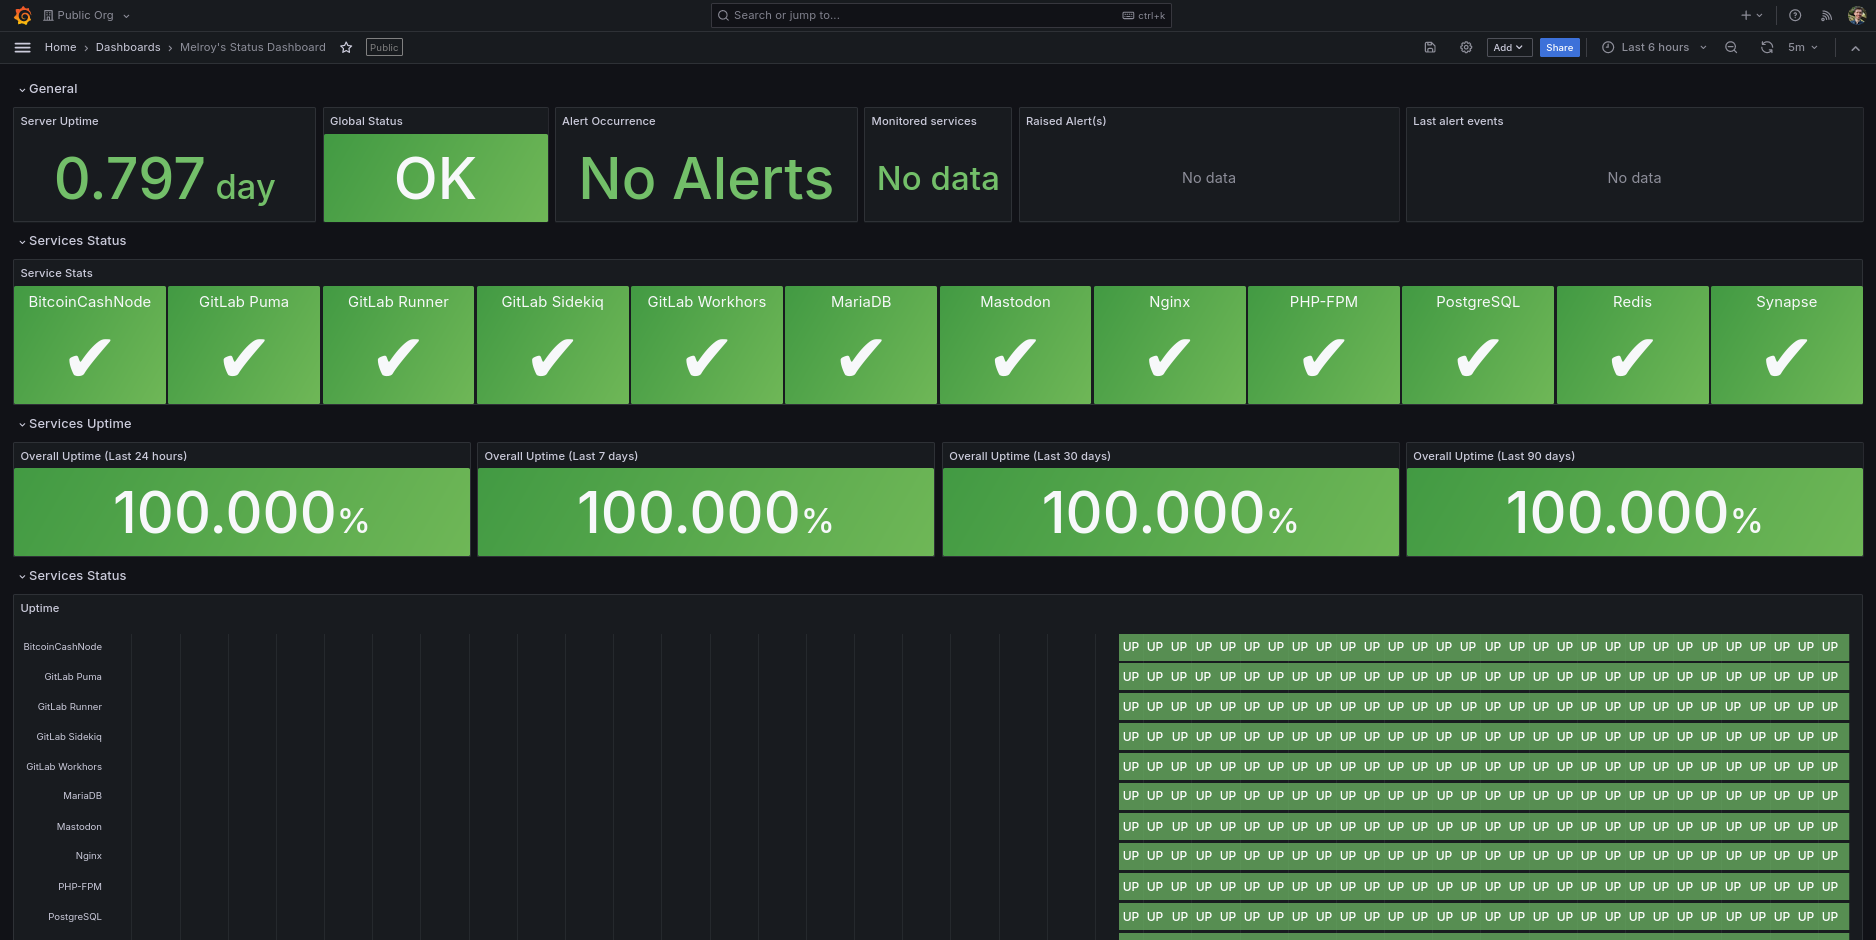
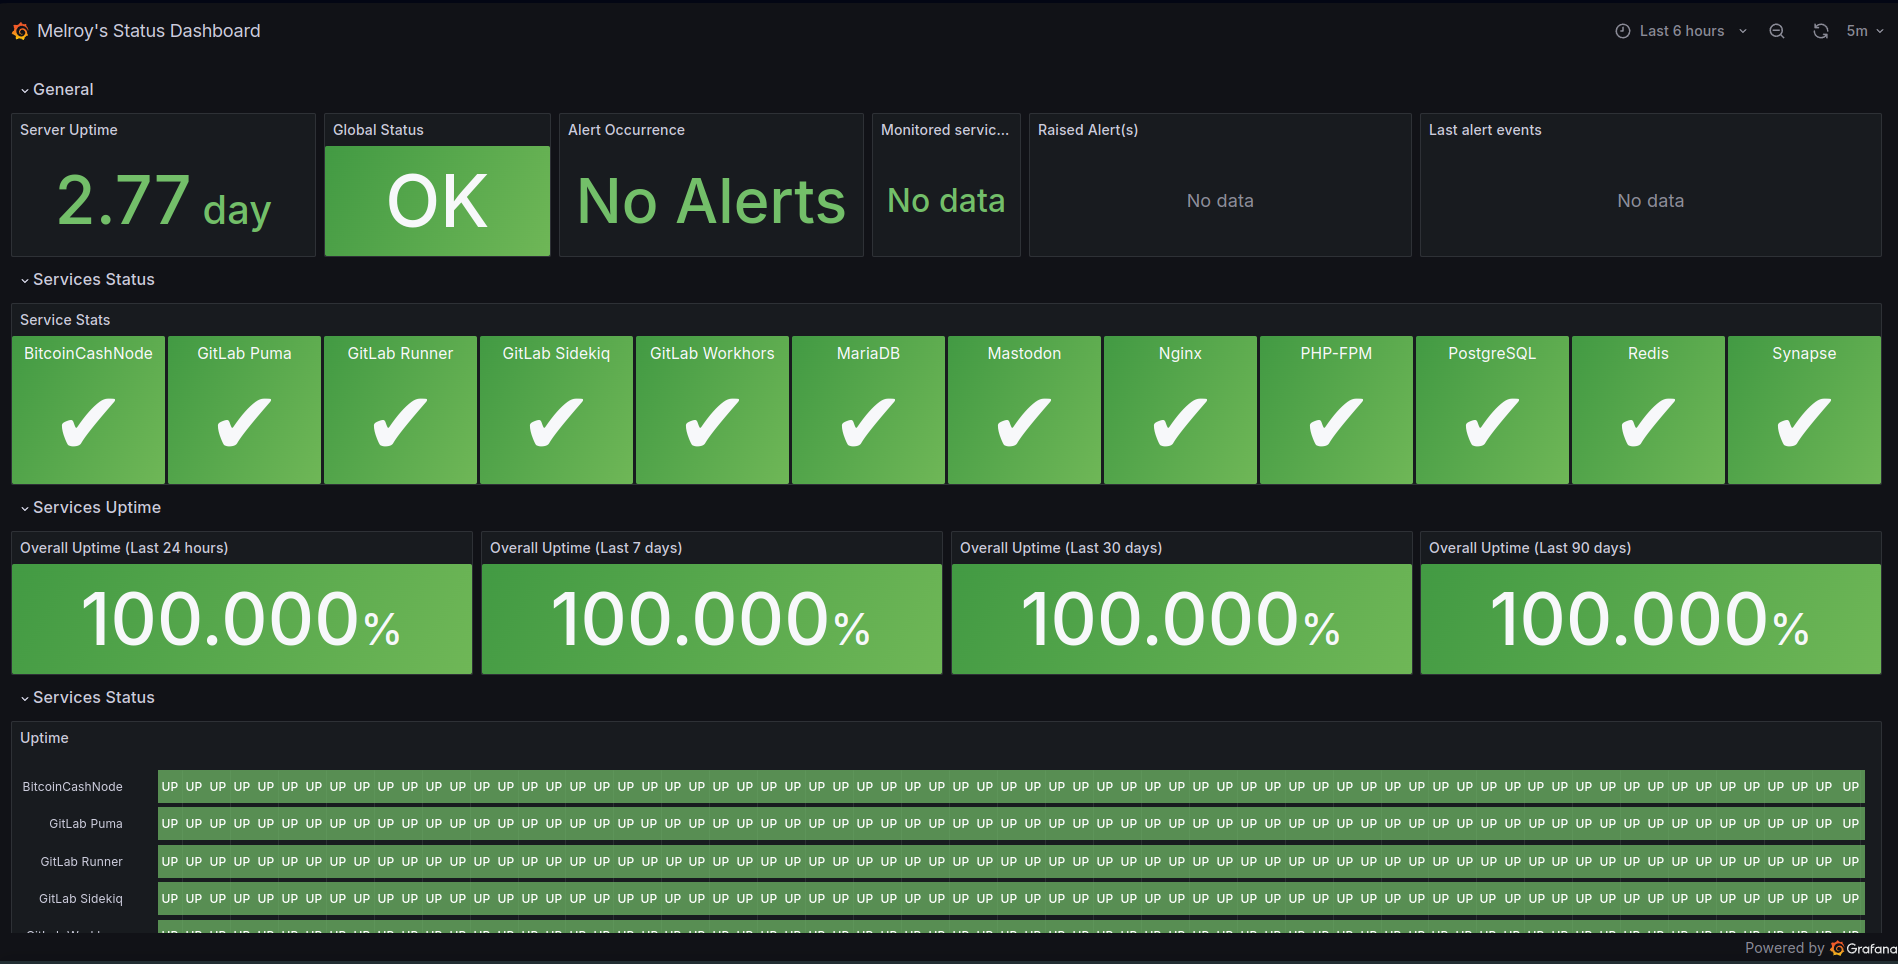
Dashboard with showing the server uptime as well as your own defined services via the exec plugin of Telegraf (I'm using pgrep Linux command to collect data). Pgrep command is used to obtain information about the process and stored into the table called nr_processes.
Since this dashboard doesn't use variables, you are able to make this dashboard public if you want to (via the share button -> Public dashboard -> Generate public URL). If your public dashboard is causing issues with retrieving data from Telegraf (401 errors), edit your grafana.ini file and enable the "influxdbBackendMigration" feature by setting it to true:
[feature_toggles]
influxdbBackendMigration = true
You will need to install Telegraf & InfluxDB for this dashboard.
Telegraf config
Add the following Telegraf configuration to your /etc/telegraf/telegraf.conf file:
[[inputs.system]]
Below the list of applications you want to track
[[inputs.exec]]
commands = ["pgrep -c nginx"]
name_override = "nr_processes"
data_format = "value"
data_type = "integer"
interval = "5m"
[inputs.exec.tags]
instance = "Nginx"
[[inputs.exec]]
commands = ["pgrep -c gitea"]
name_override = "nr_processes"
data_format = "value"
interval = "5m"
[inputs.exec.tags]
instance = "Gitea"
[[inputs.exec]]
commands = ["pgrep -c gitlab-runner"]
name_override = "nr_processes"
data_format = "value"
interval = "5m"
[inputs.exec.tags]
instance = "GitLab Runner"
[[inputs.exec]]
commands = ["pgrep -c gitlab-workhors"]
name_override = "nr_processes"
data_format = "value"
interval = "5m"
[inputs.exec.tags]
instance = "GitLab Workhors"
[[inputs.exec]]
commands = ["pgrep -fc -u git puma"]
name_override = "nr_processes"
data_format = "value"
interval = "5m"
[inputs.exec.tags]
instance = "GitLab Puma"
[[inputs.exec]]
commands = ["pgrep -fc -u git sidekiq"]
name_override = "nr_processes"
data_format = "value"
interval = "5m"
[inputs.exec.tags]
instance = "GitLab Sidekiq"
[[inputs.exec]]
commands = ["pgrep -c -u redis redis-server"]
name_override = "nr_processes"
data_format = "value"
interval = "5m"
[inputs.exec.tags]
instance = "Redis"
[[inputs.exec]]
commands = ["pgrep -c -u postgres postgres"]
name_override = "nr_processes"
data_format = "value"
interval = "5m"
[inputs.exec.tags]
instance = "PostgreSQL"
[[inputs.exec]]
commands = ["pgrep -c mysql"]
name_override = "nr_processes"
data_format = "value"
interval = "5m"
[inputs.exec.tags]
instance = "MariaDB"
[[inputs.exec]]
commands = ["pgrep -c php-fpm"]
name_override = "nr_processes"
data_format = "value"
interval = "5m"
[inputs.exec.tags]
instance = "PHP-FPM"
[[inputs.exec]]
commands = ["pgrep -fc synapse.app.homeserver"]
name_override = "nr_processes"
data_format = "value"
interval = "5m"
[inputs.exec.tags]
instance = "Synapse"
Of course add your own services to this list above! It's just an example list...
Data source config
Collector config:
Upload an updated version of an exported dashboard.json file from Grafana
| Revision | Description | Created | |
|---|---|---|---|
| Download |