Troubleshooting Kubernetes (simple and fast view)
Simple and fast Troubleshooting Dashboard for kubernetes
Troubleshooting Kubernetes (simple and fast view)
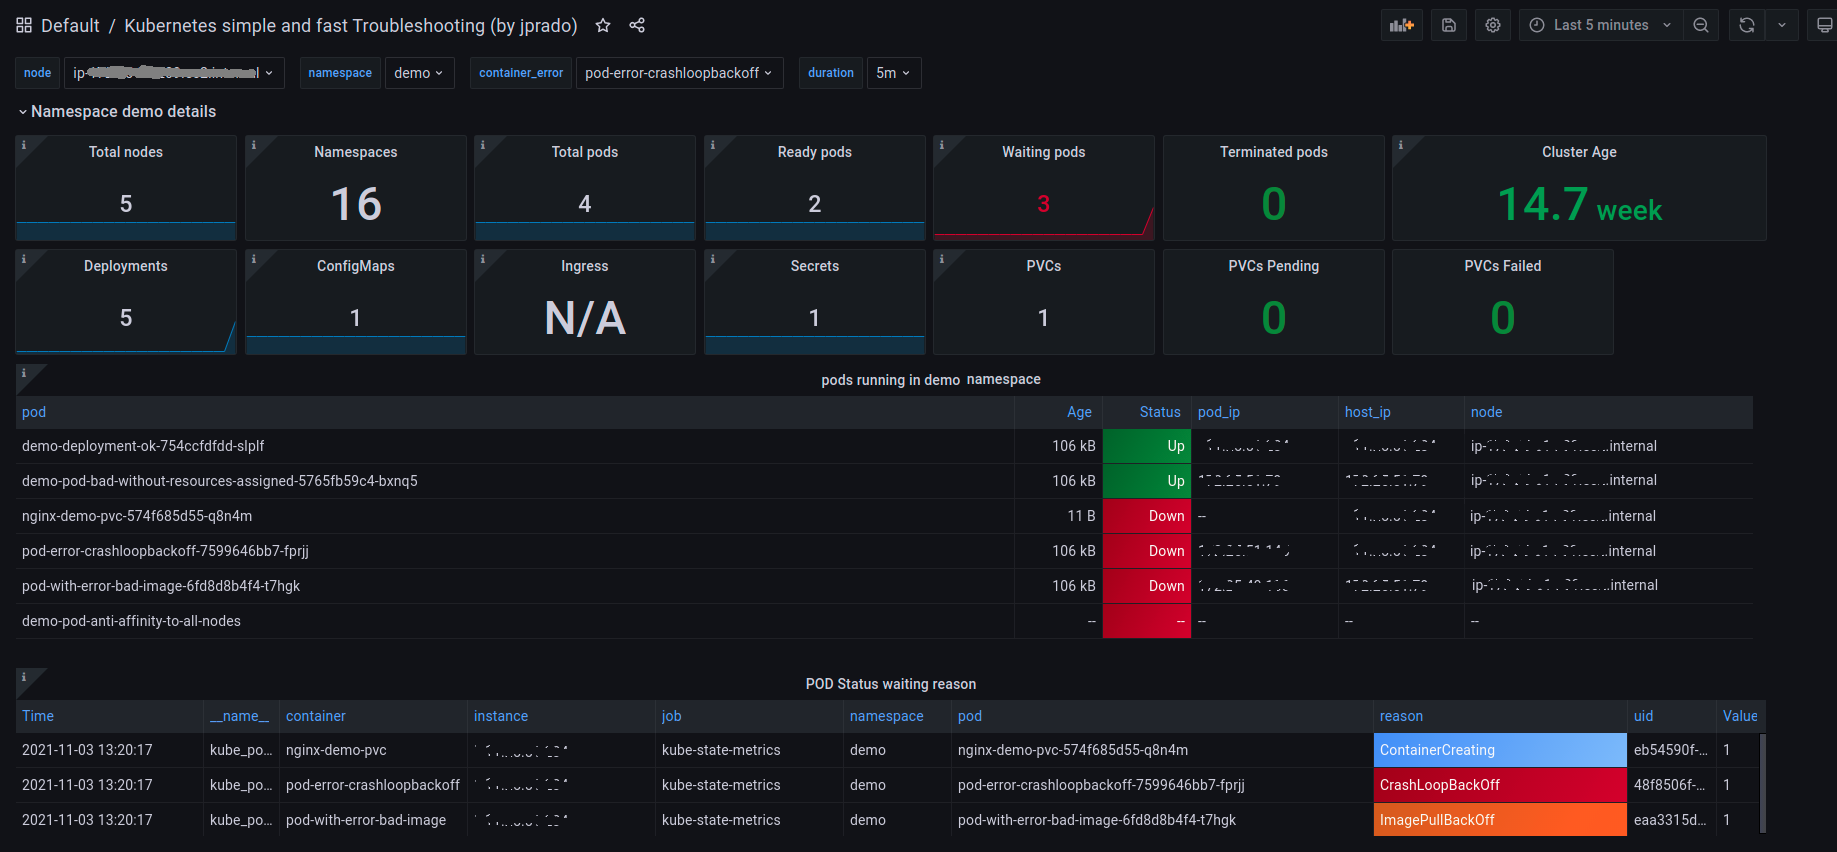
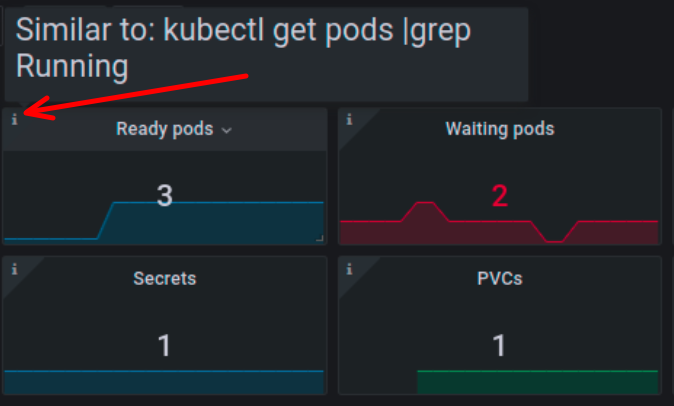
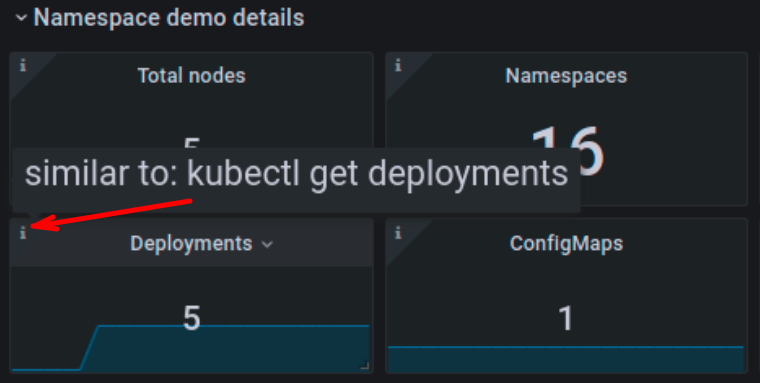
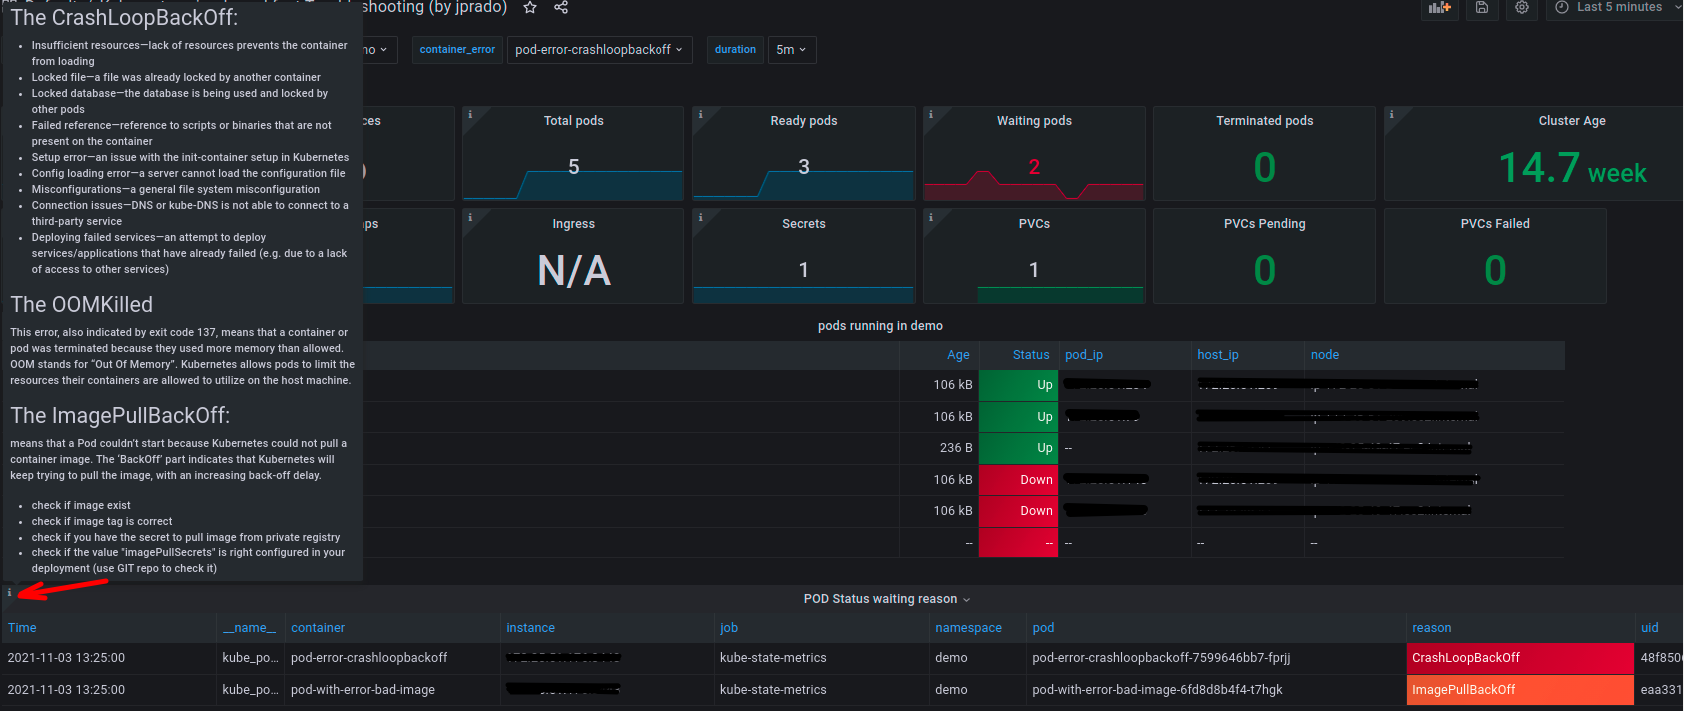
Simple dashboard that allows you to view basic information about deployments, pods, logs, errors and more. It also has detailed information (on each panel icon) to understand what type of error and possible causes. (Pods reason error) It is very useful for quick troubleshooting and fast and vast visualization
Features
- Visualization of logs by container
- Visualization of objects in the namespace (pod, configmas, deployments, etc)
- Display of pods with error
- Crash cause display (pod error reason)
- Visualization of volumes and space available in them
- Visualization of income and ports
Source:
Data source config
Collector config:
Upload an updated version of an exported dashboard.json file from Grafana
| Revision | Description | Created | |
|---|---|---|---|
| Download |
Kubernetes
Monitor your Kubernetes deployment with prebuilt visualizations that allow you to drill down from a high-level cluster overview to pod-specific details in minutes.
Learn more


