Node Exporter for Prometheus Dashboard based on 11074
Dashboard for production env troubleshooting, modified based on https://grafana.com/grafana/dashboards/11074 enhancements, The overall resource overview! Support Grafana6&7,Support Node Exporter v0.16 and above.Optimize the main metrics display. Includes: CPU, memory, disk IO, network, temperature and other monitoring metrics
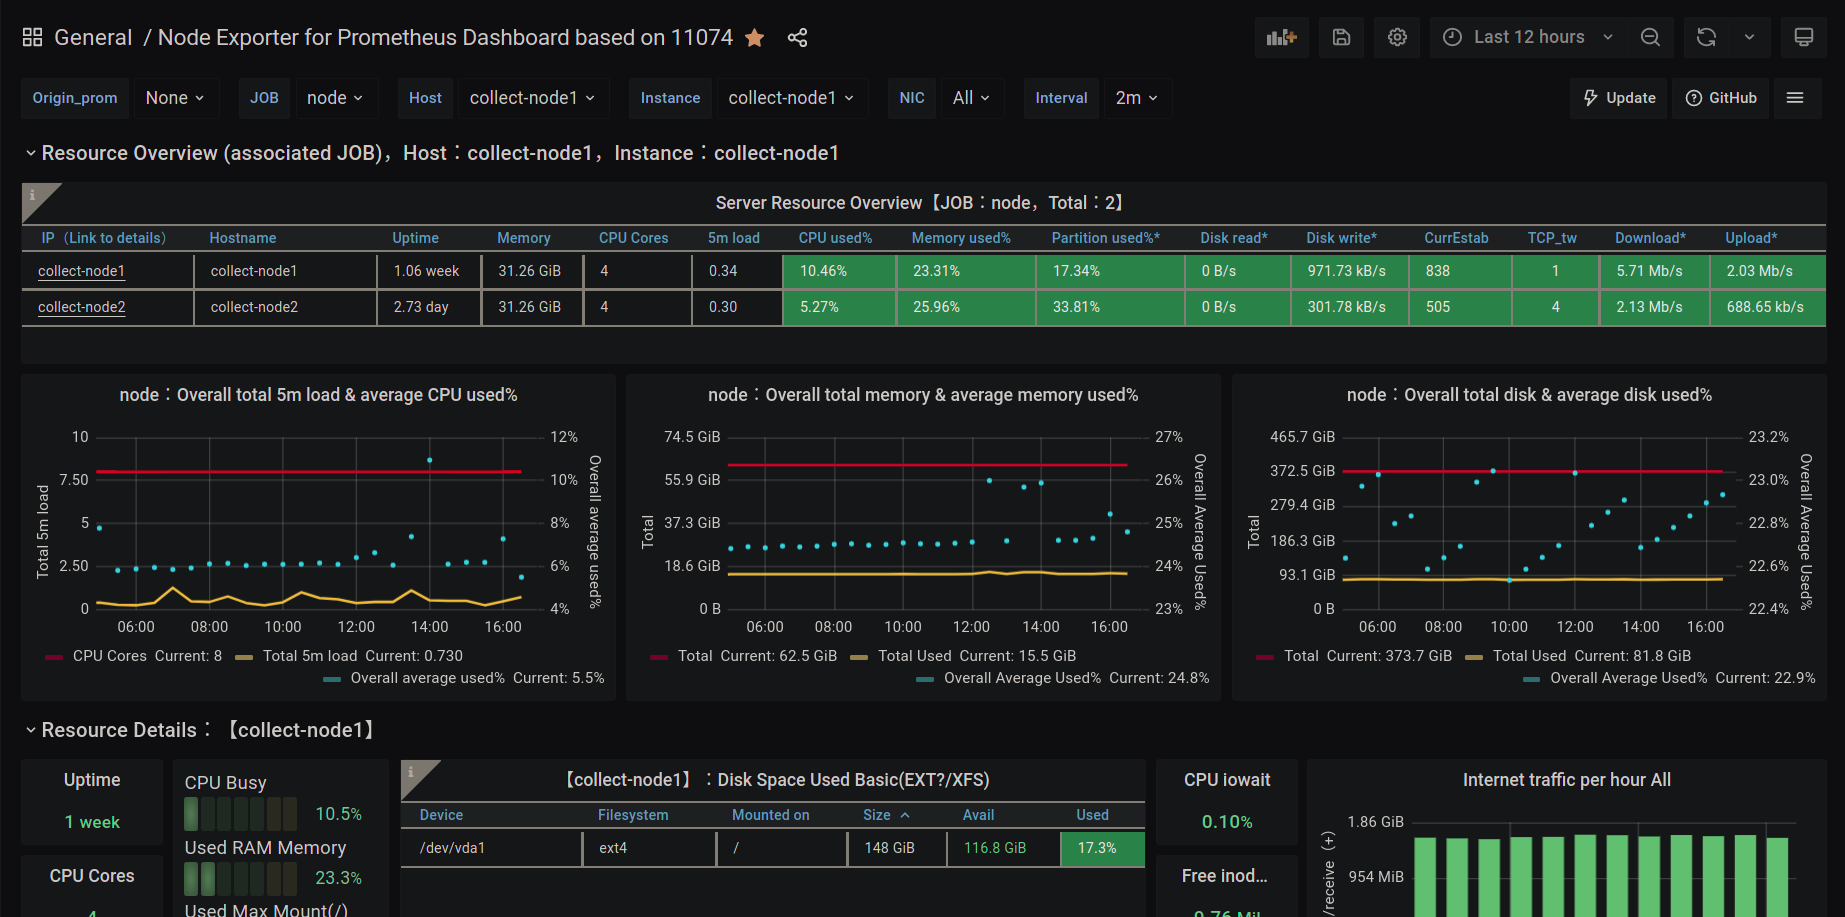
Dashboard for production env troubleshooting, modified based on https://grafana.com/grafana/dashboards/11074 enhancements, The overall resource overview! Support Grafana6&7,Support Node Exporter v0.16 and above.Optimize the main metrics display. Includes: CPU, memory, disk IO, network, temperature and other monitoring metrics
Data source config
Collector config:
Upload an updated version of an exported dashboard.json file from Grafana
| Revision | Description | Created | |
|---|---|---|---|
| Download |
Linux Server
Monitor Linux with Grafana. Easily monitor your Linux deployment with Grafana Cloud's out-of-the-box monitoring solution.
Learn more