1 - Deployment Performance & Health
Watch performance, errors, latency, and infrastructure metrics for your workload
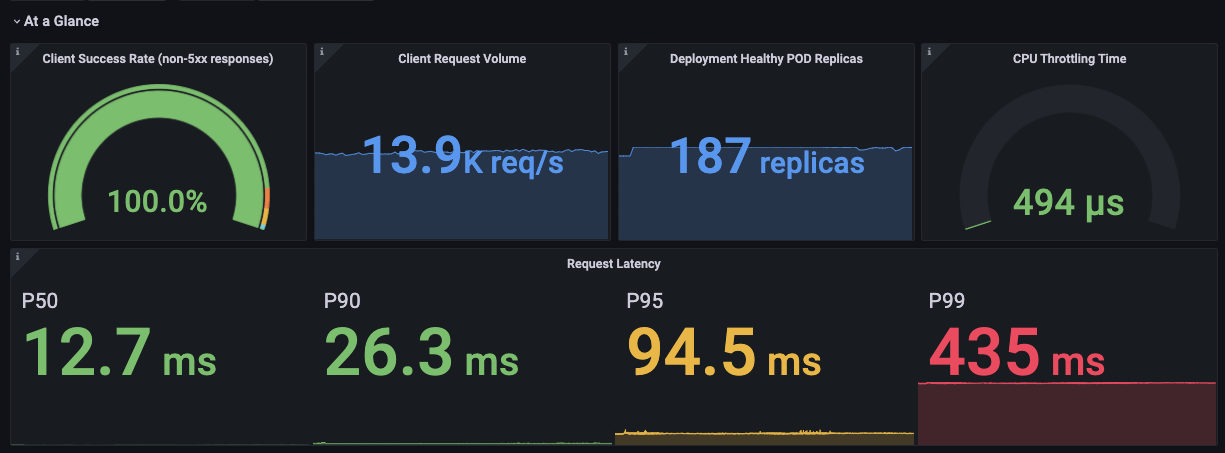
A parameterized dashboard for common workload types (deployment, daemonSet, statefulSet) that has charts that pull Prometheus metrics from Kubernetes, Istio, and node-exporter and visualizes metrics in several categories (by panel):
- At a Glance - A quick view of the health of your Kubernetes-based app (assumes it's web service, so it's mostly Istio metrics like success, latency, etc)
- RED (Requests, Errors, Duration) - SRE "Golden Signals" that come from Istio
- USE (Utilization, Saturation, Errors) - SRE "Golden Signals" that come from Kubernetes
- Infra Resources - POD distribution by host and AZ, HPA metrics, image tag, oomkills, CPU throttling, total deployment allocated CPU's & memory, and more
Select your account, cluster, namespace, and then your workload name, and all charts will render.
Data source config
Collector type:
Collector plugins:
Collector config:
Revisions
Upload an updated version of an exported dashboard.json file from Grafana
| Revision | Description | Created | |
|---|---|---|---|
| Download |