
Pydio Cells Monitoring (Advanced)
Dashboard for Pydio Cells, including additional data collected from third-party exporters
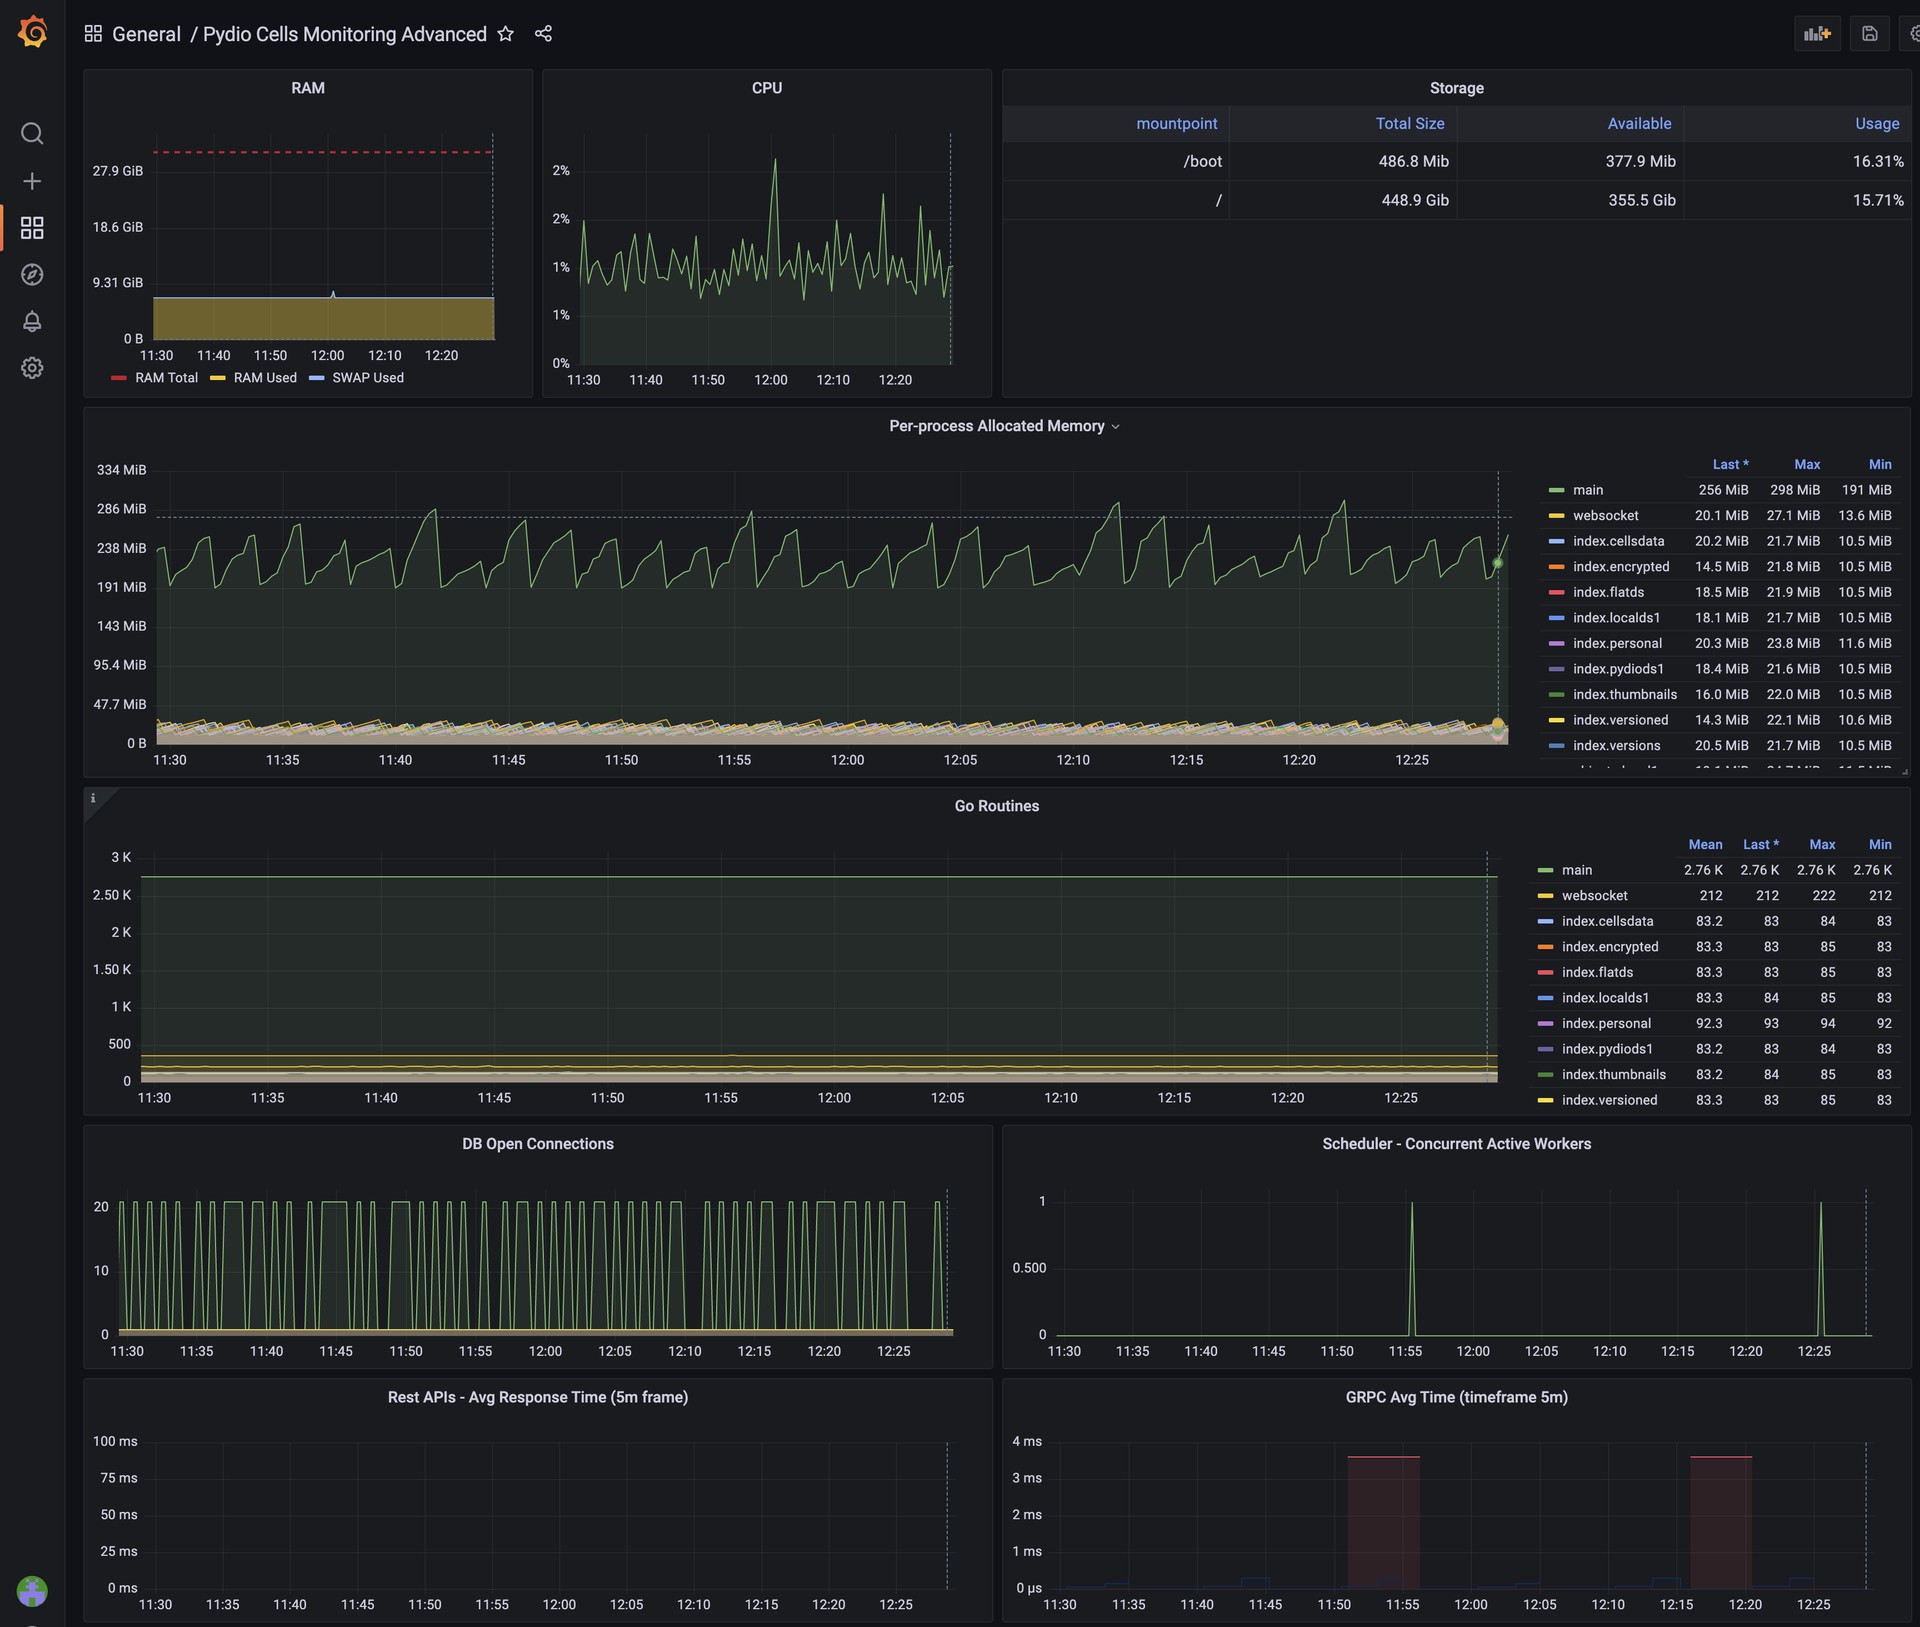
This is a dashboard for Pydio Cells metrics. It exposes useful information about the processes’ status: memory, go-routines, average response times for REST and GRPC calls, etc, as well as server-generic metrics collected from node_exporter, mysql_exporter, etc.
Prerequisites to collect the metrics are the following:
Enable the metrics endpoints on Cells by exporting the environment variable
CELLS_ENABLE_METRICS=trueor by adding the flag--enable_metricsto cells’ start command.
and for the prometheus.yml configuration append this instruction.
- job_name: "cells"
    file_sd_configs:
      - files:
          - ${CELLS_WORKING_DIR}/services/pydio.gateway.metrics/prom_clients.json
Make sure to replace $CELLS_WORKING_DIR by your actual working directory.
Data source config
Collector config:
Dashboard revisions
Upload an updated version of an exported dashboard.json file from Grafana
| Revision | Decscription | Created | |
|---|---|---|---|
| Download |
Get this dashboard
Data source:
Dependencies: