Azure / Alert Consumption
A summary of all alerts for the subscription and other filters selected
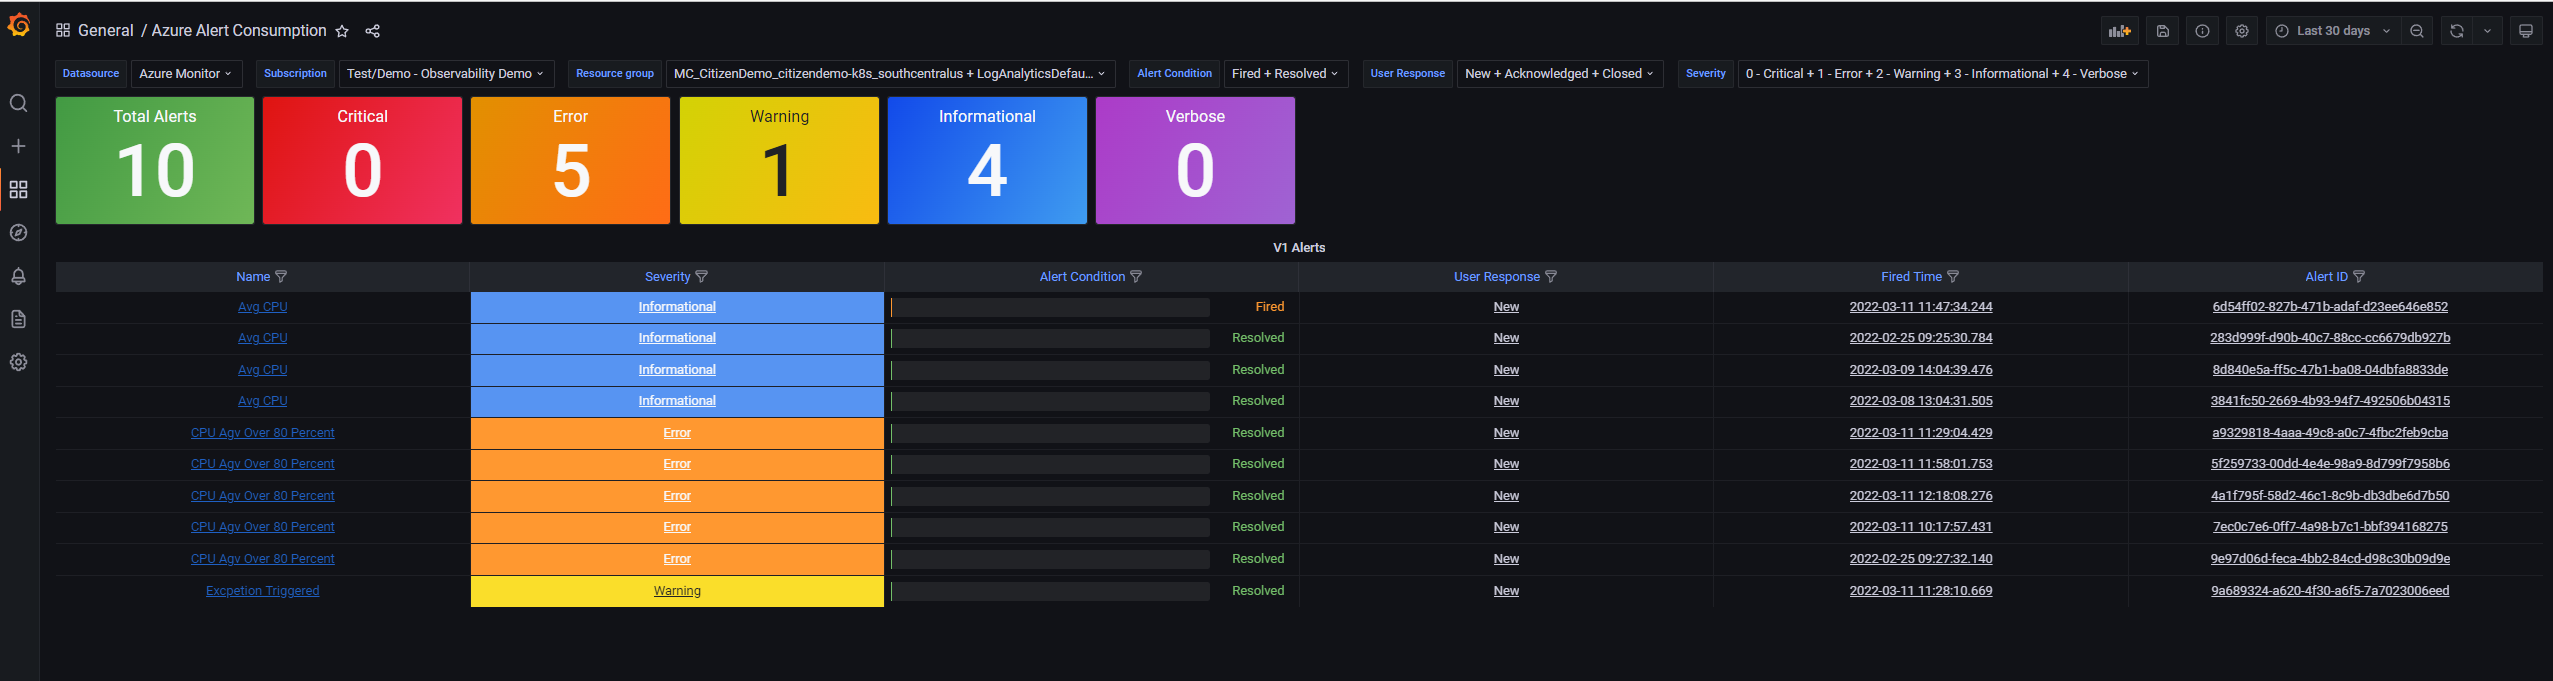
Using Azure Monitor data source, this dashboard helps you visualize an overview of all Azure alerts that were fired for the specified resource group/s. The table shows key details like Severity, Monitor condition, Alert state, Affected resource among others. Data can also be filtered on multiple columns allowing you to narrow the type of alerts displayed.
More information:
Send your feedback to azmongrafana@microsoft.com
Data source config
Collector type:
Collector plugins:
Collector config:
Revisions
Upload an updated version of an exported dashboard.json file from Grafana
| Revision | Description | Created | |
|---|---|---|---|
| Download |
Azure Cosmos DB
With the Grafana plugin for Azure Cosmos DB, you can quickly visualize and query your Azure Cosmos DB data from within Grafana.
Learn more