qBittorrent Dashboard
Grafana Dashboard for qBittorrent
This repository contains a Grafana dashboard for qBittorrent using Prometheus.
It integrates with qbittorrent-exporter.
View it on Grafana Community Dashboards.
Features
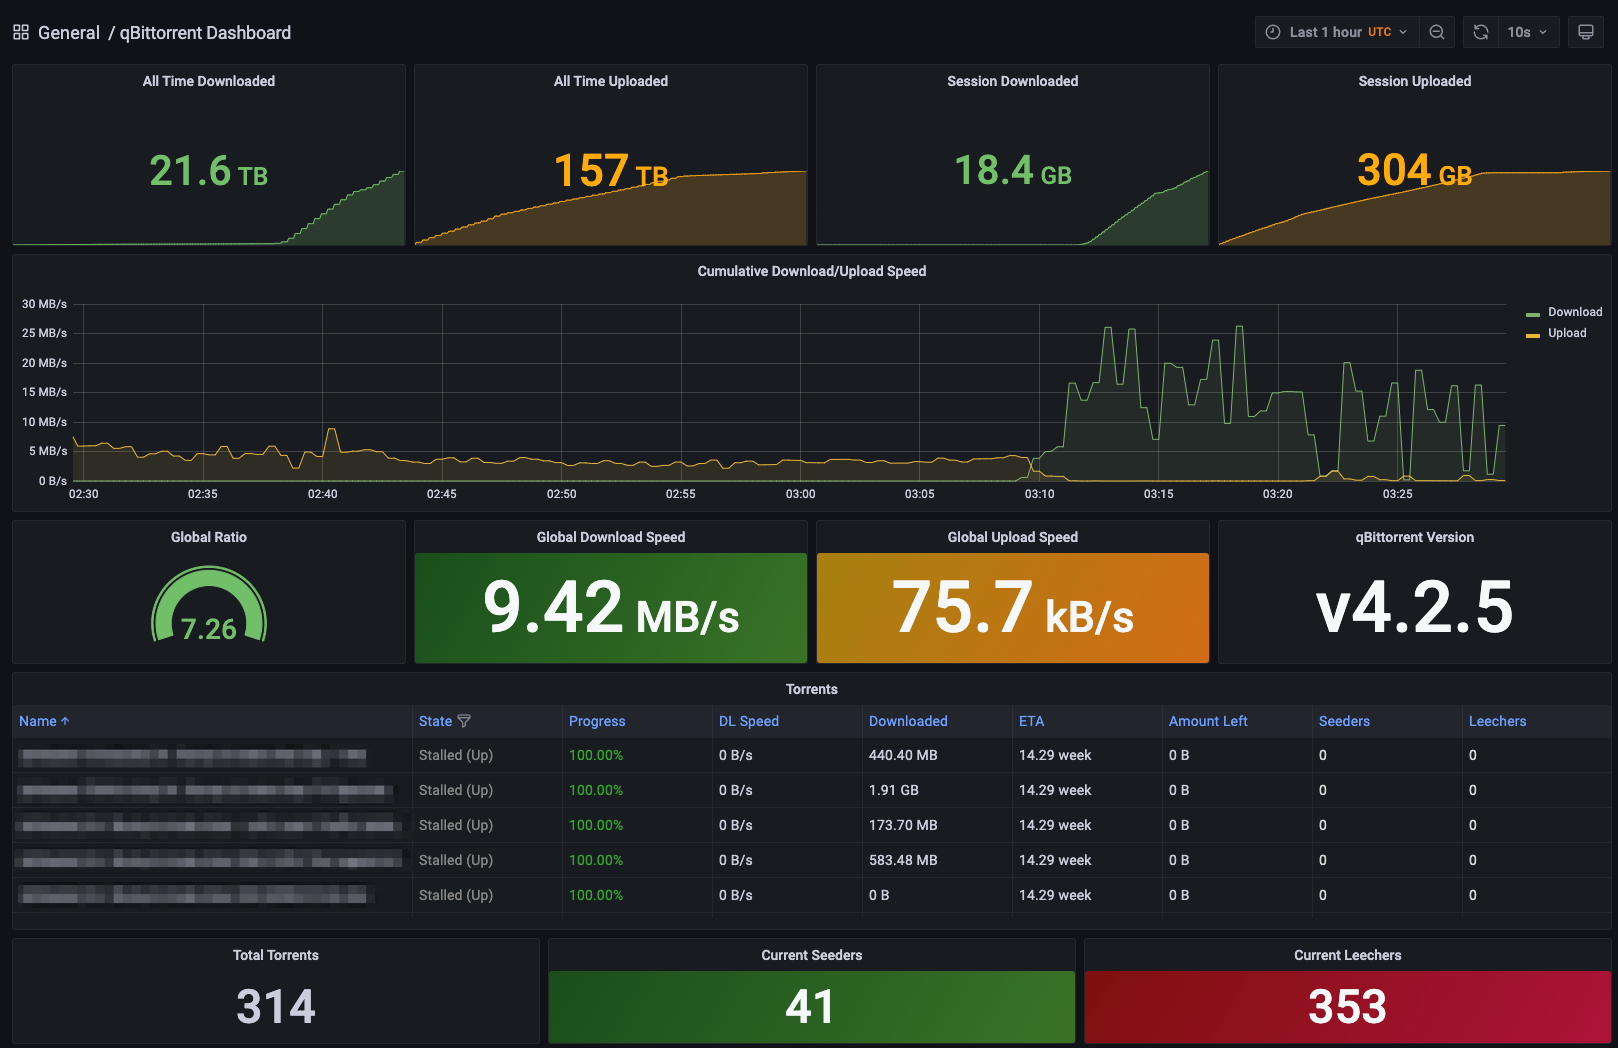
It shows the following metrics:
- All time download/upload
- Session download/upload
- Cumulative upload/download speeds
- Global ratio/download speed/upload speed
- App version
- Torrent list with statuses
- Total torrents/seeders/leechers
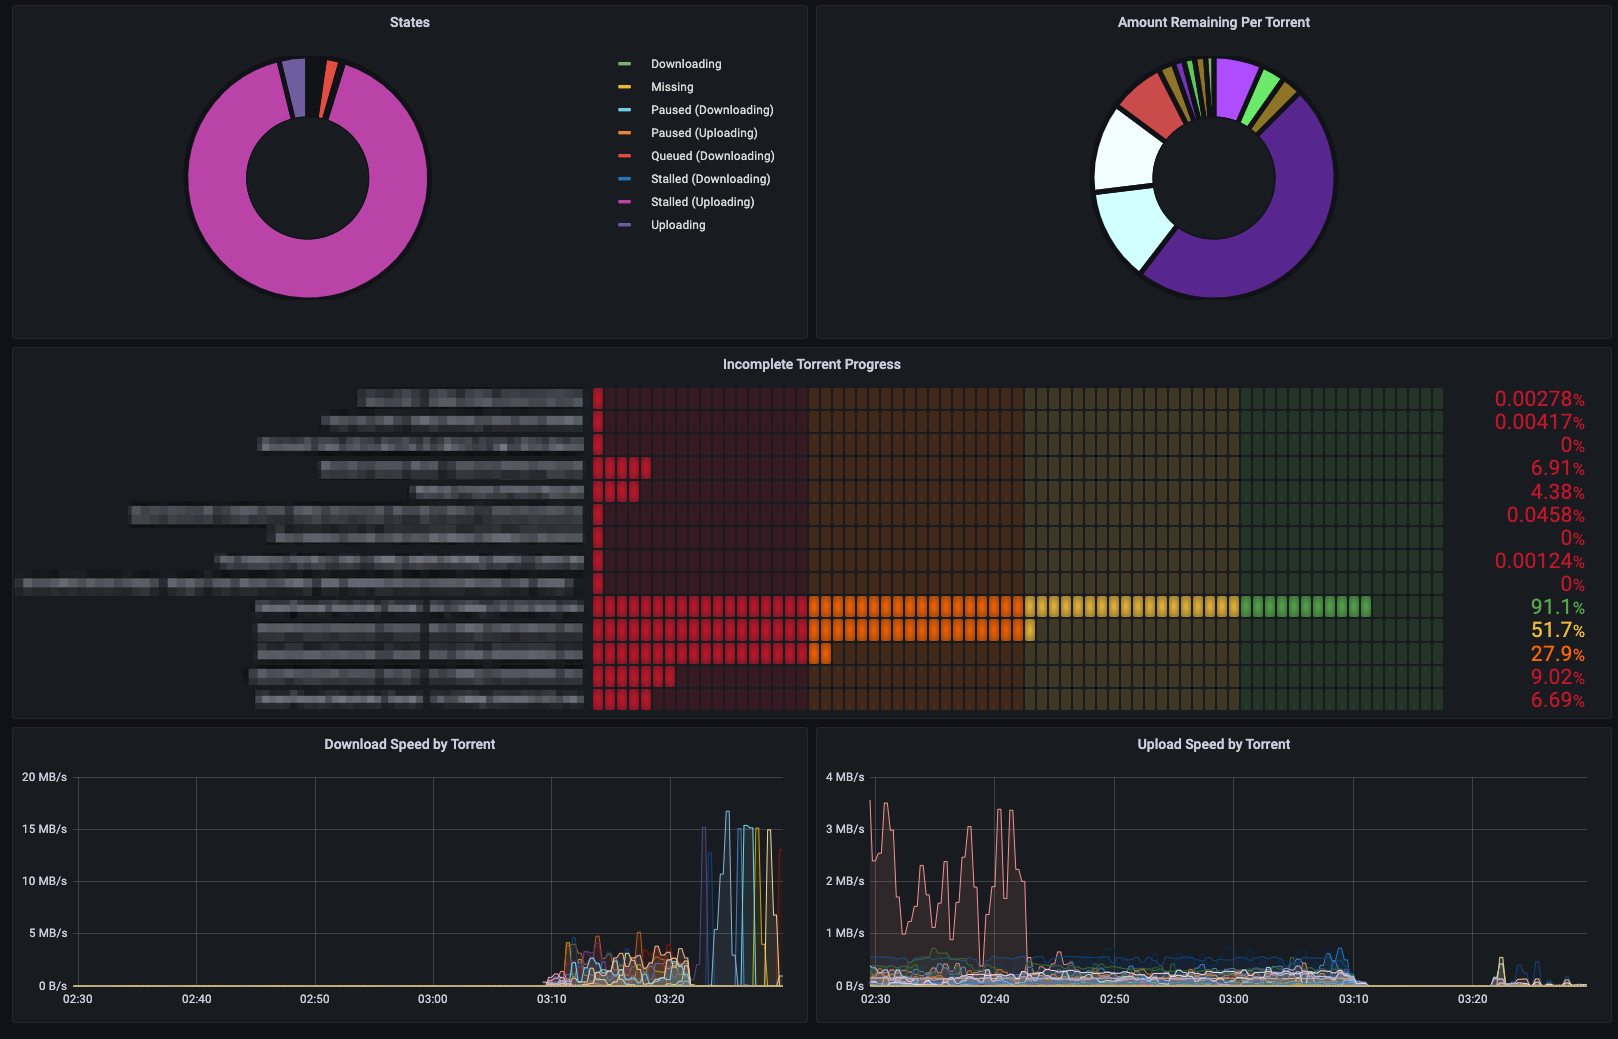
- Torrent state chart
- Amount remaining by torrent
- Incomplete torrent progress
- Download/upload speed by torrent
Requirements
This dashboard requires grafana-piechart-panel for some panels. You can install by running any of these:
# Grafana CLI
grafana-cli plugins install grafana-piechart-panel
Download and unzip manually
wget -nv https://grafana.com/api/plugins/grafana-piechart-panel/versions/latest/download -O grafana-piechart-panel.zip
unzip -q grafana-piechart-panel.zip -d .
mv grafana-piechart-panel /var/lib/grafana/plugins/grafana-piechart-panel
rm grafana-piechart-panel.zip
Clone the Git repo
git clone https://github.com/grafana/piechart-panel.git –branch release-1.6.1
mv piechart-panel /var/lib/grafana/plugins/grafana-piechart-panel
Restart your Grafana server after installing the plugin.
Data source config
Collector config:
Upload an updated version of an exported dashboard.json file from Grafana
| Revision | Description | Created | |
|---|---|---|---|
| Download |