njmon for Linux Processes v6
Use njmon on AIX for Linux v76+ You need to request Process data to be collected using the -P option. Also use the -t 5 option to only collect processes using 5% of a CPU or more. This eliminates lots of process data for minor CPU using processes. Even try -t 50 to capture the naughty list of processes (some might be in accidental loops or stuck in loop).
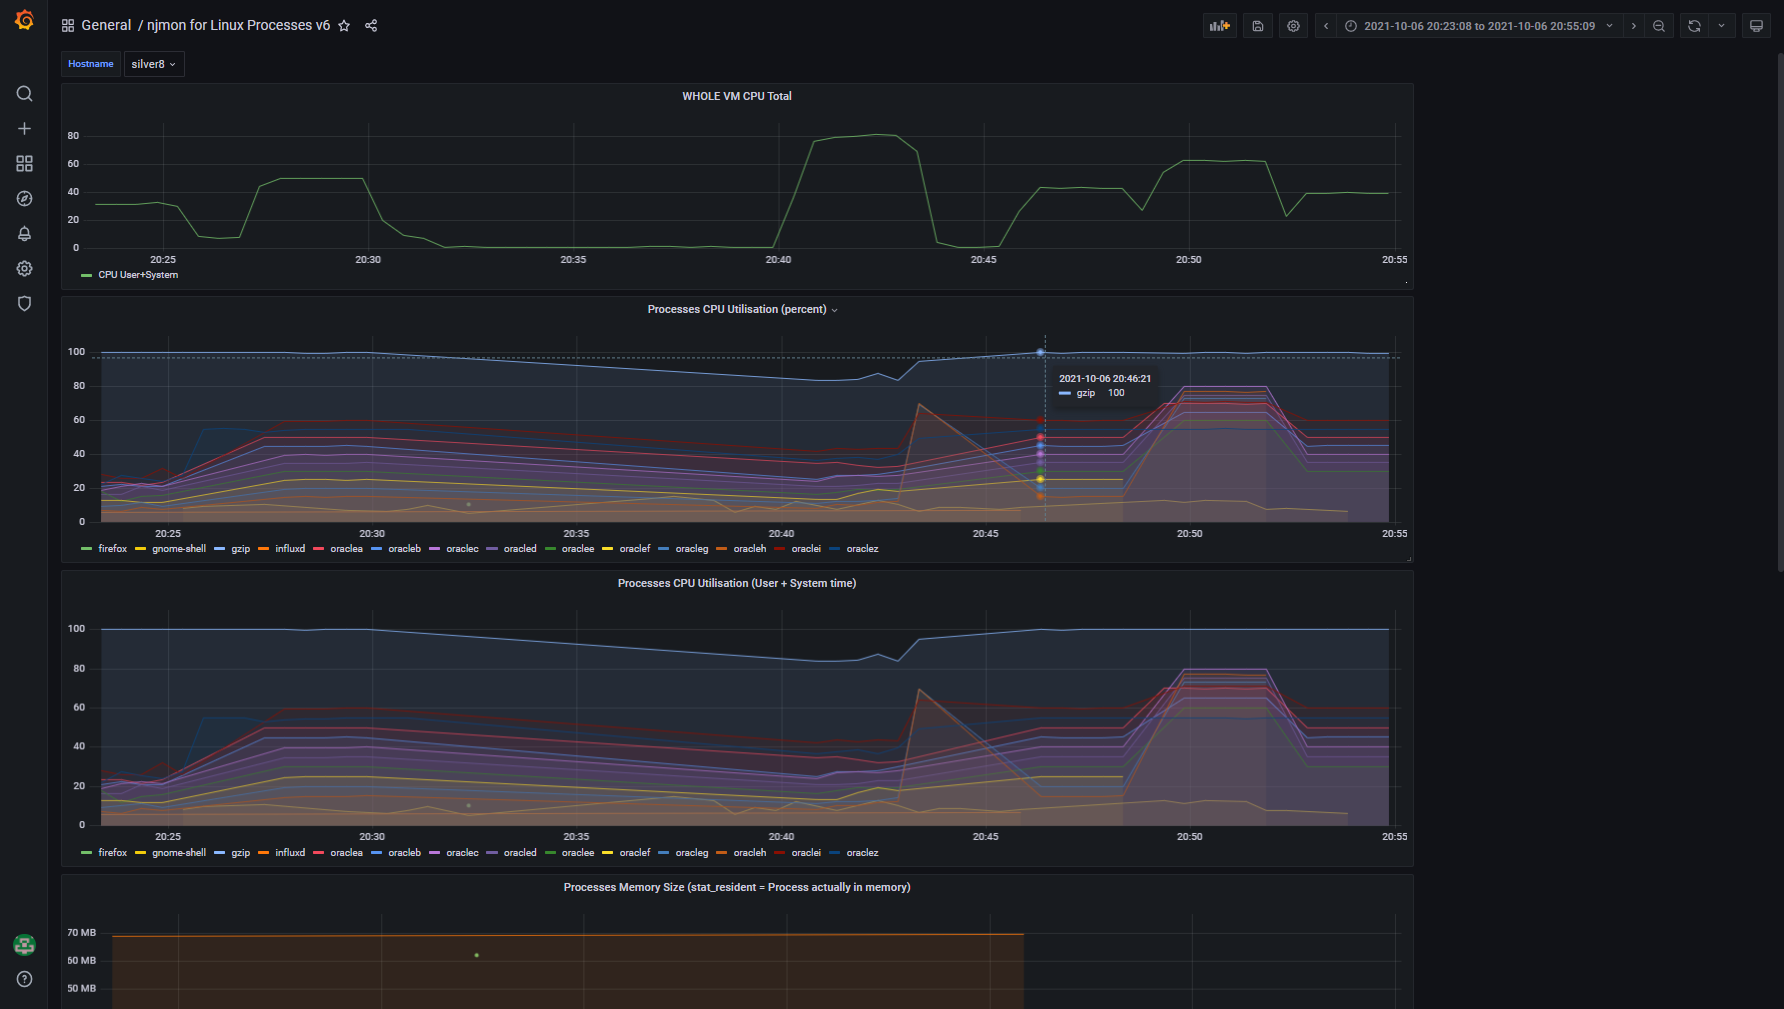
Top graph is the Virtual Machine CPU use - if this is low there is not much point looking at further details. Then by process:
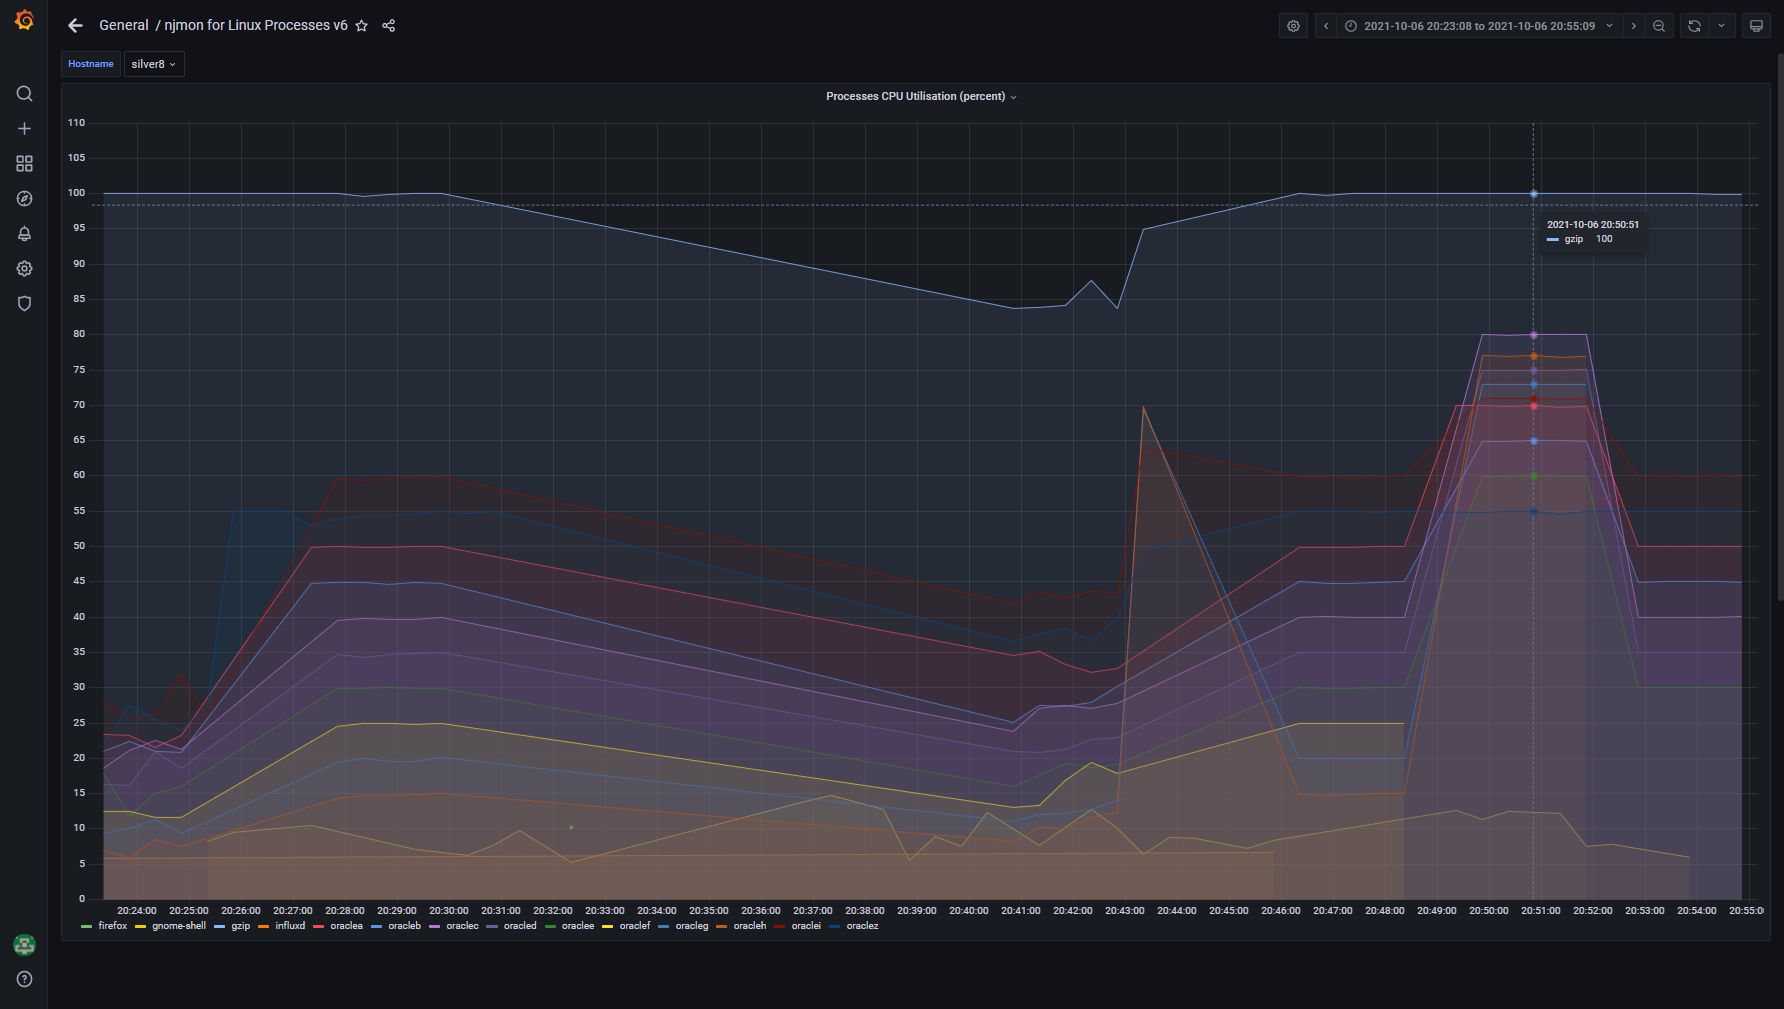
- CPU Percent
- CPU user + system
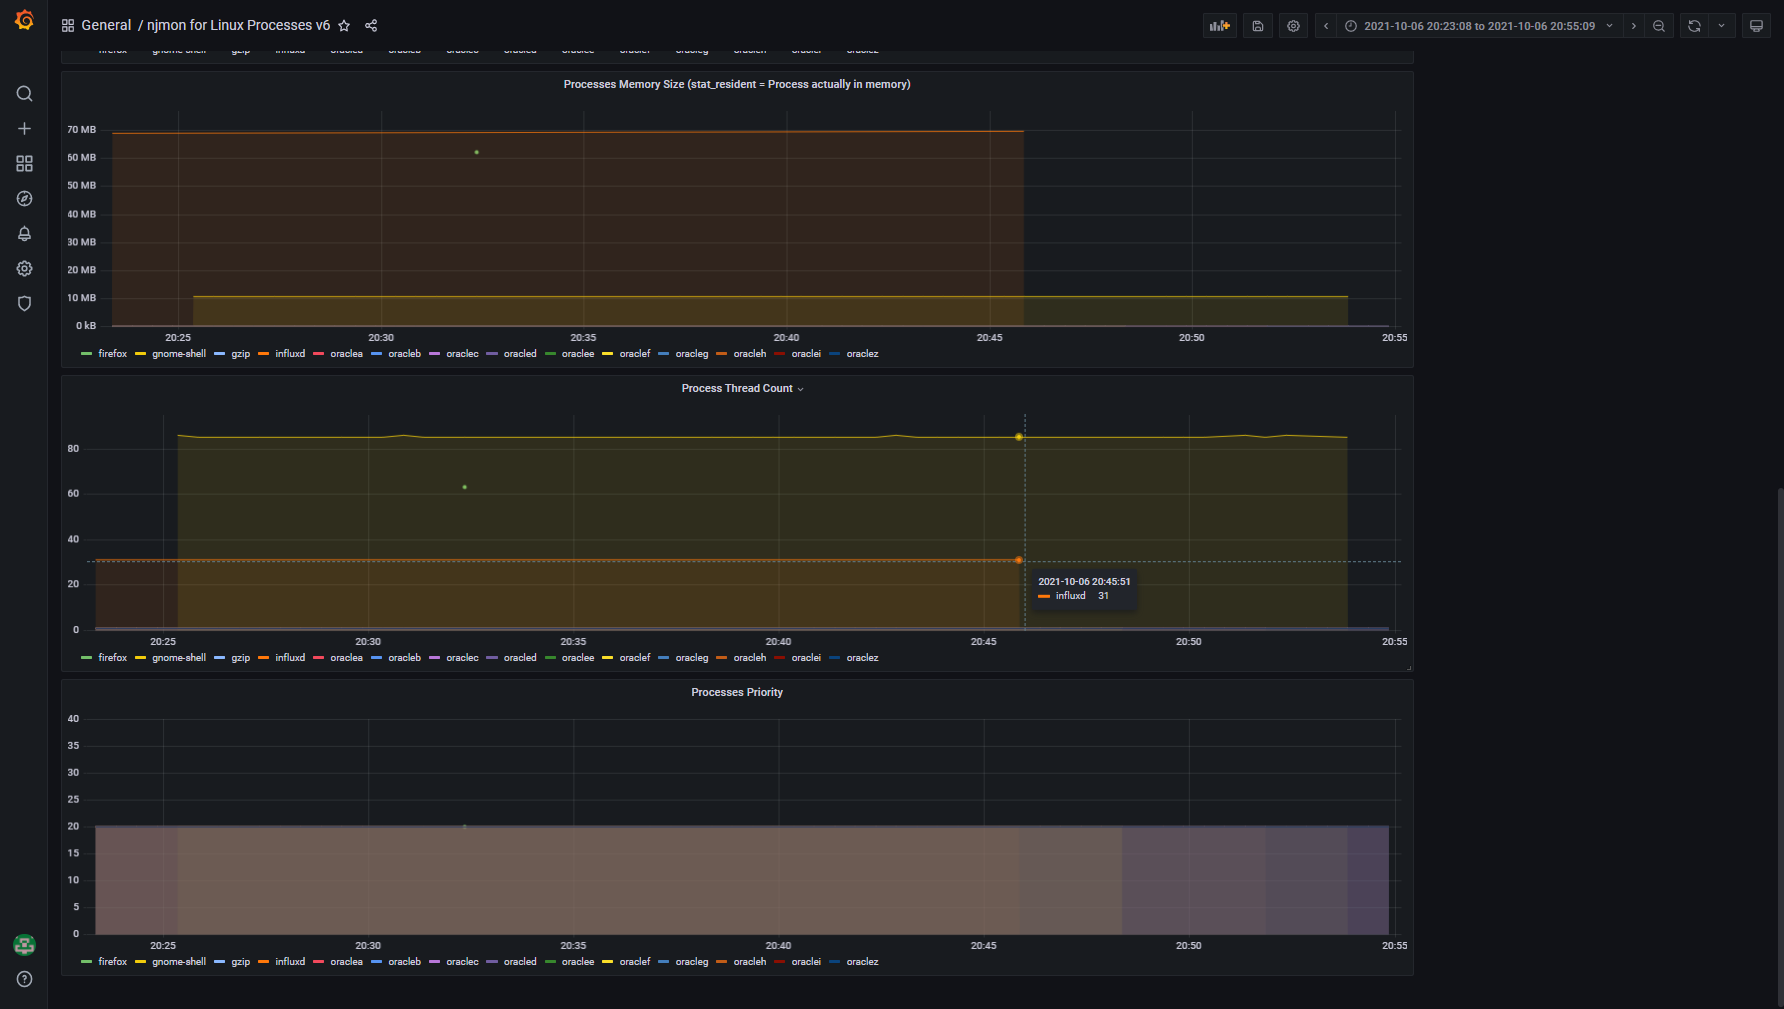
- Memory resident set size = Actually in memory pages (not on disk or paging space)
- Thread count
- Priority There are many other values you could graph
Data source config
Collector type:
Collector plugins:
Collector config:
Revisions
Upload an updated version of an exported dashboard.json file from Grafana
| Revision | Description | Created | |
|---|---|---|---|
| Download |
Linux Server
Monitor Linux with Grafana. Easily monitor your Linux deployment with Grafana Cloud's out-of-the-box monitoring solution.
Learn more