
Exa Advanced k6 Dashboard
An advanced dashboard for visualizing results from the k6.io load testing tool, using the InfluxDB exporter to track and watch requests with their status codes and latencies.
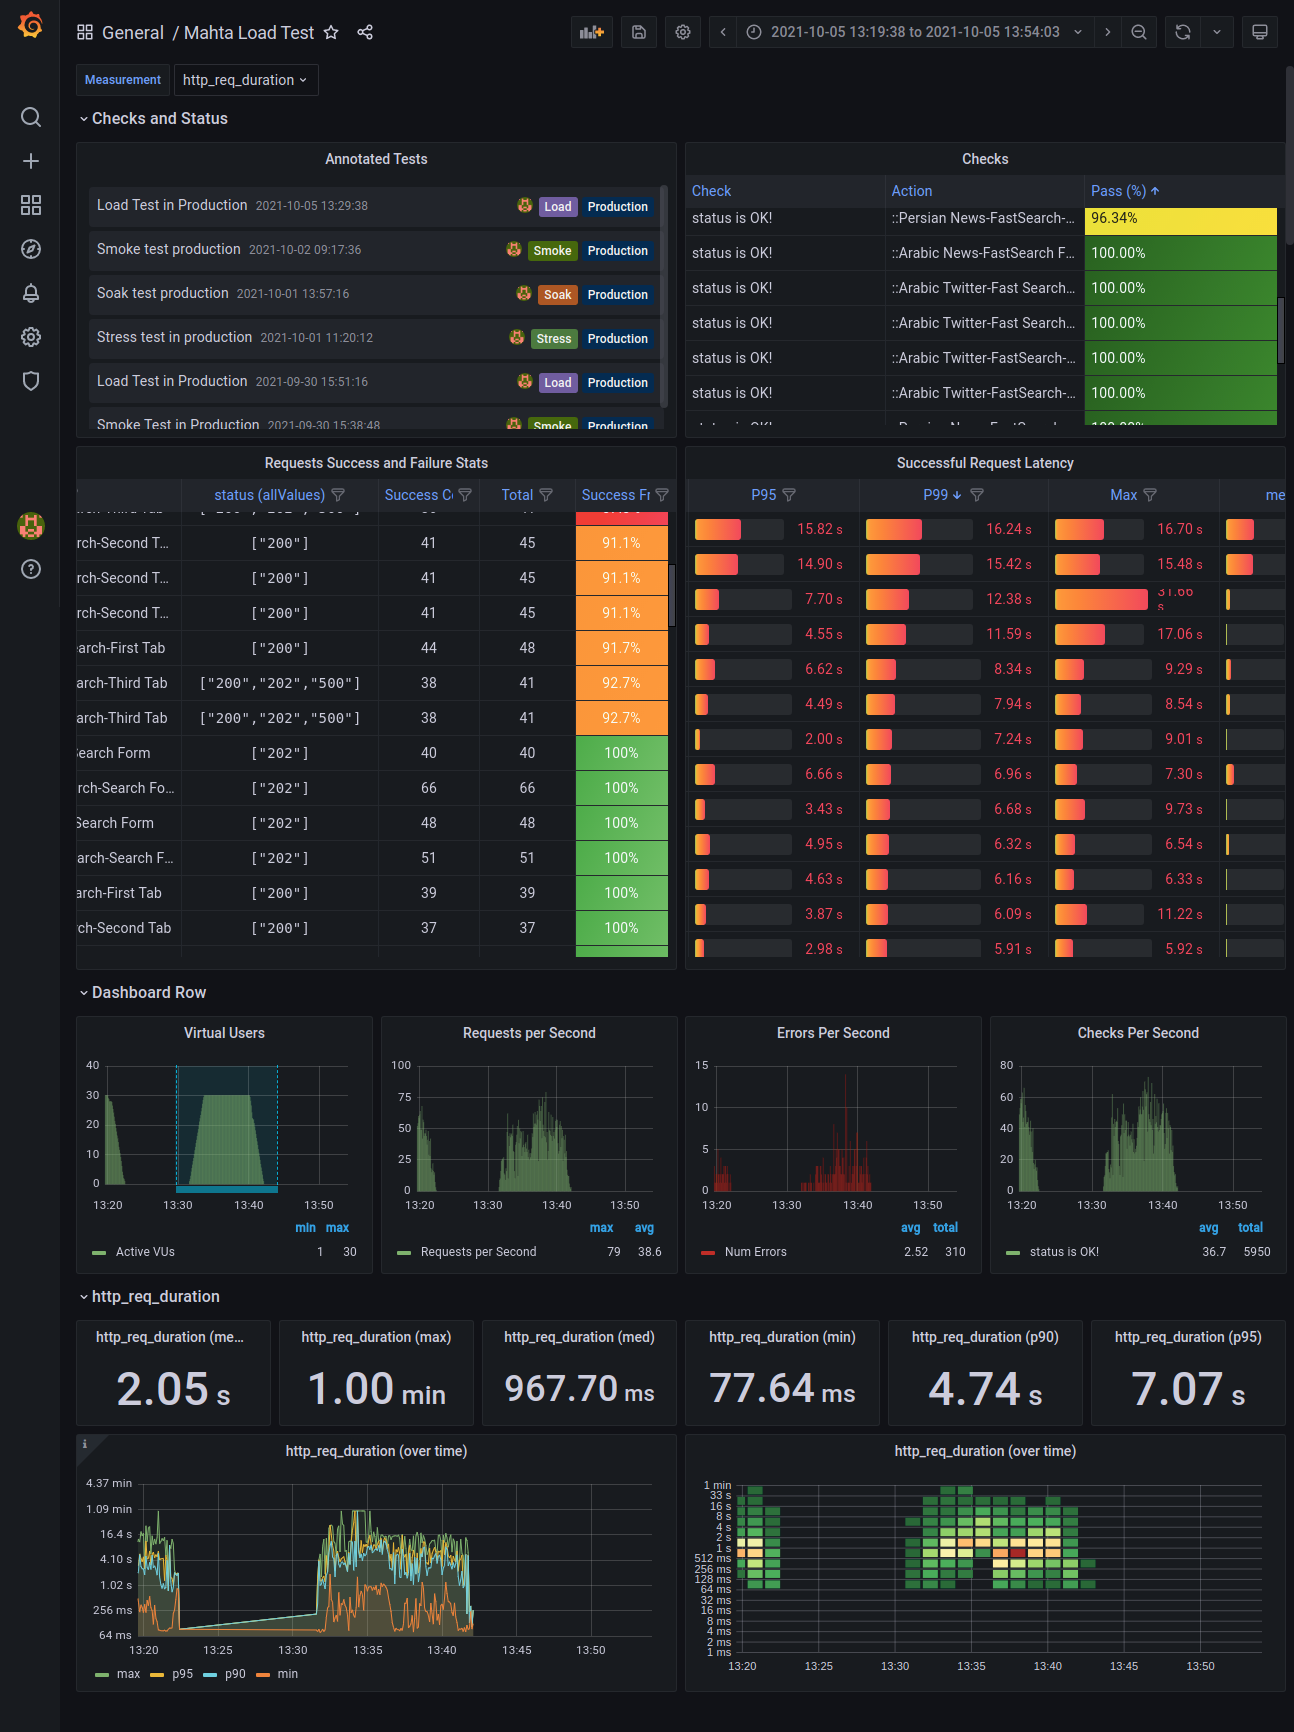
A dashboard for visualizing results from the k6.io load testing tool, using the InfluxDB to track and watch requests with their status codes and latencies. This helps to find bottlenecks and failure points easier. The following panels are added to currently available dashboards:
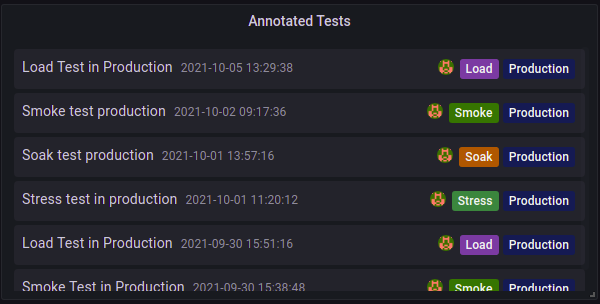
- "Annotated Tests" table to access tests cycles easier.
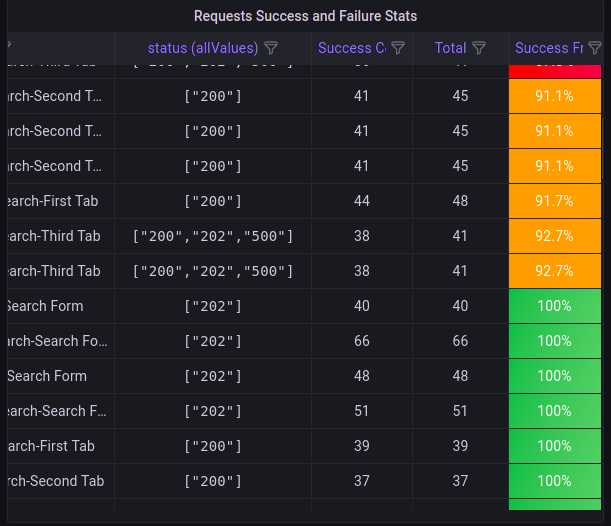
- "Requests Success and Failure Stats" table to track success and failed endpoints with their status codes.
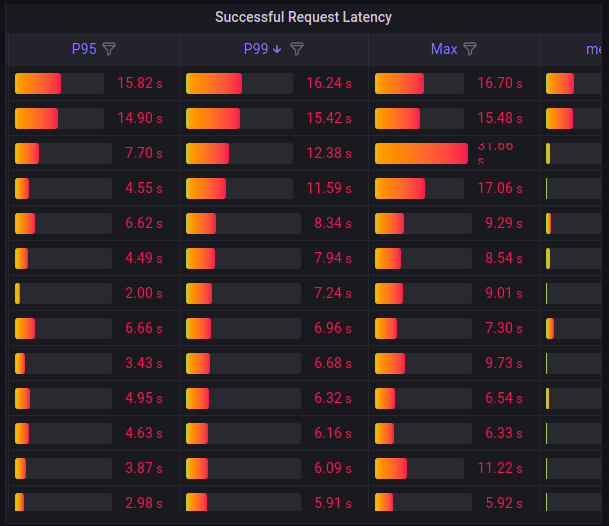
- "Successful Requests Latency" table to watch slow and fast requests with more detail.
Data source config
Collector type:
Collector plugins:
Collector config:
Revisions
Upload an updated version of an exported dashboard.json file from Grafana
| Revision | Description | Created | |
|---|---|---|---|
| Download |