MongoDB
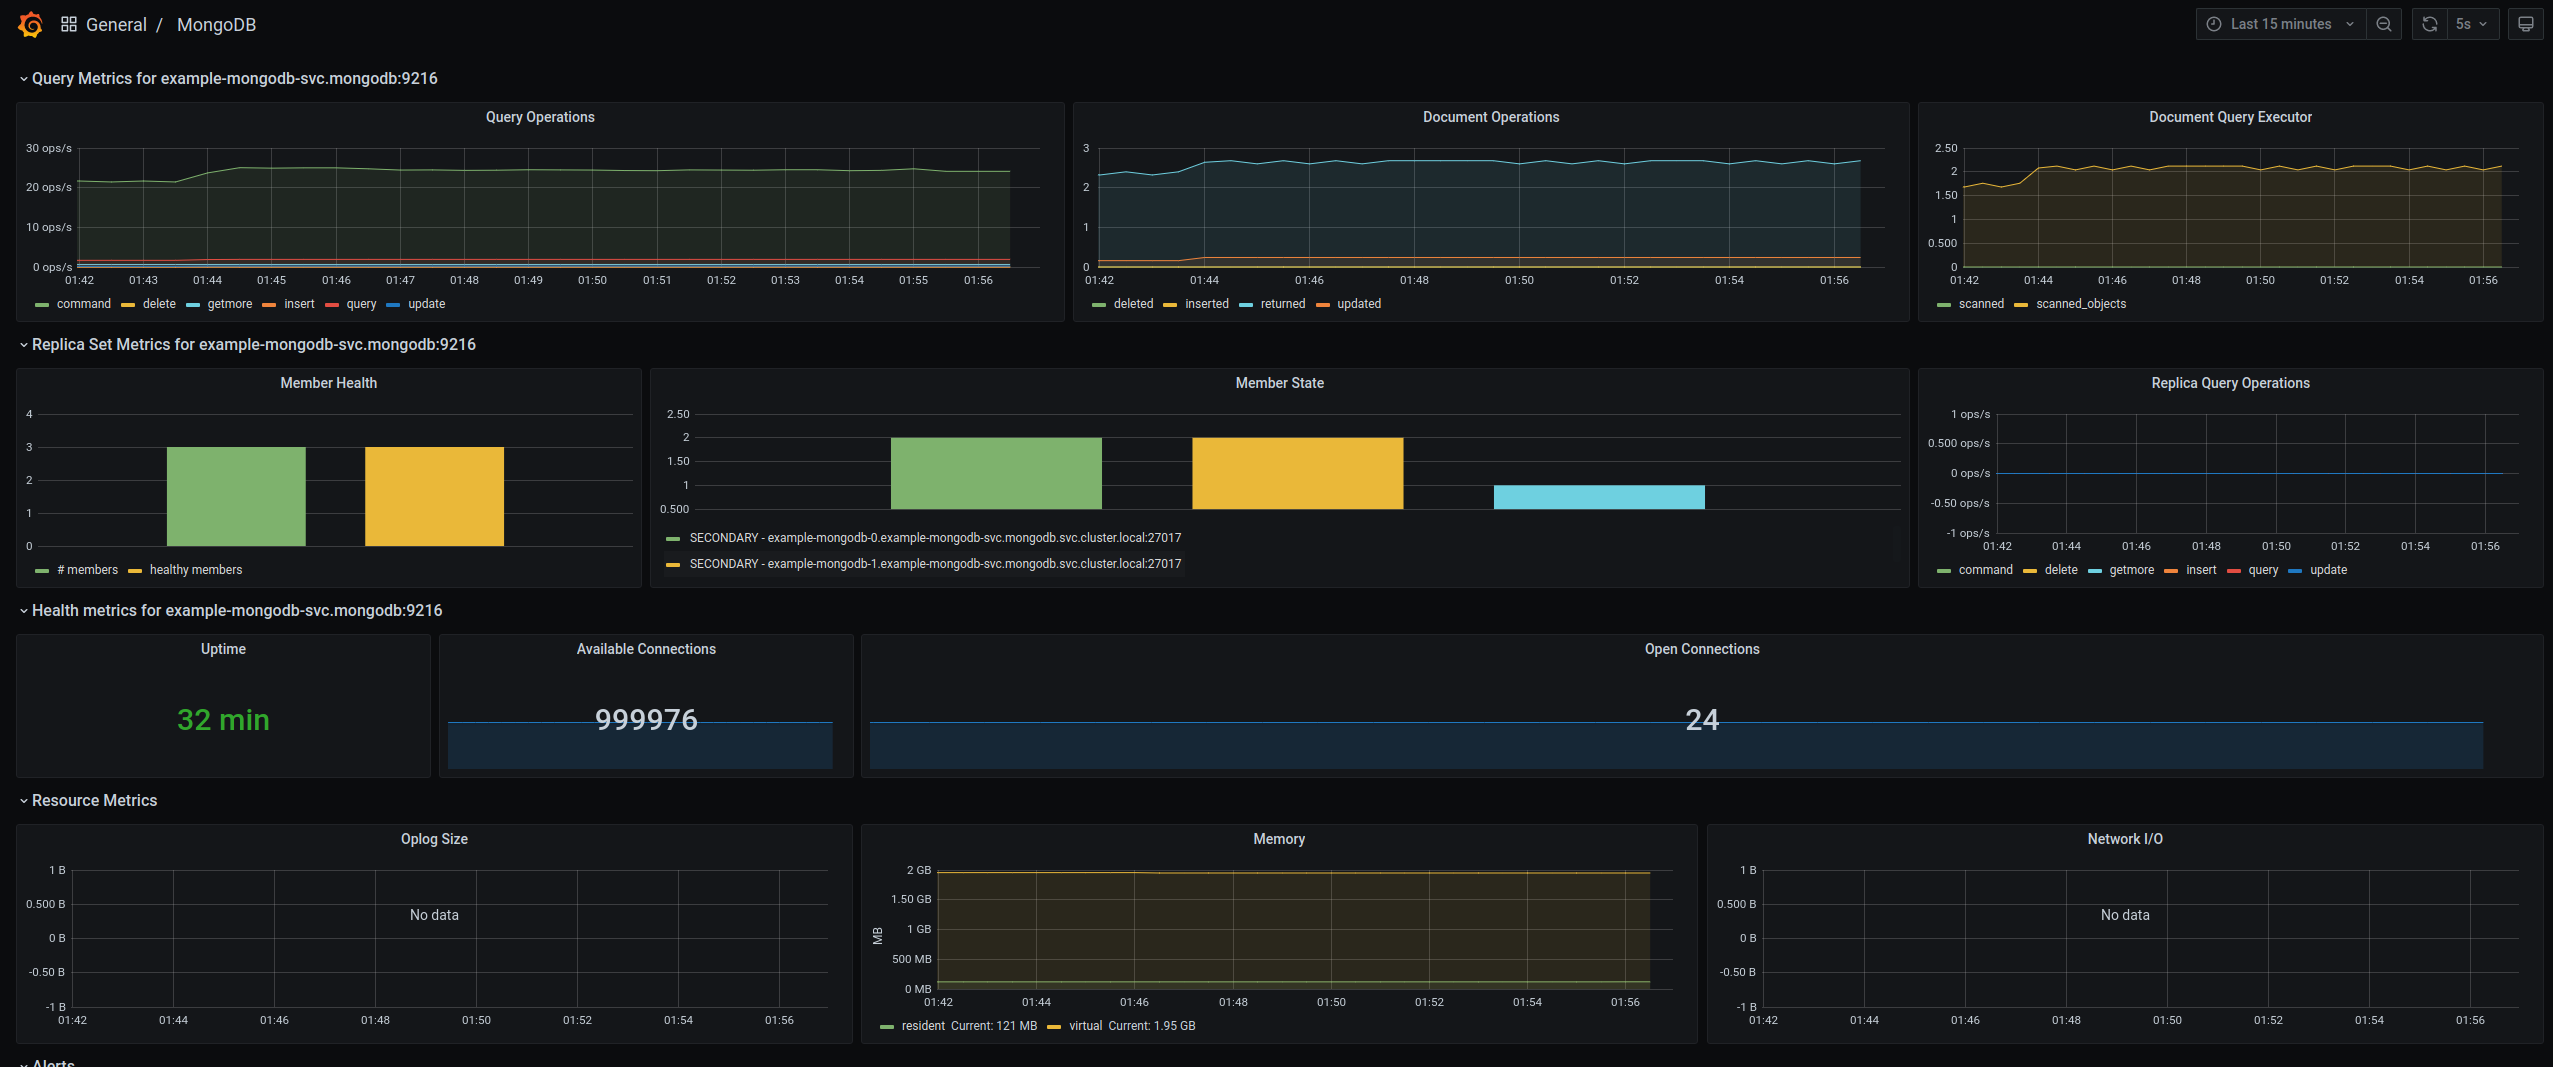
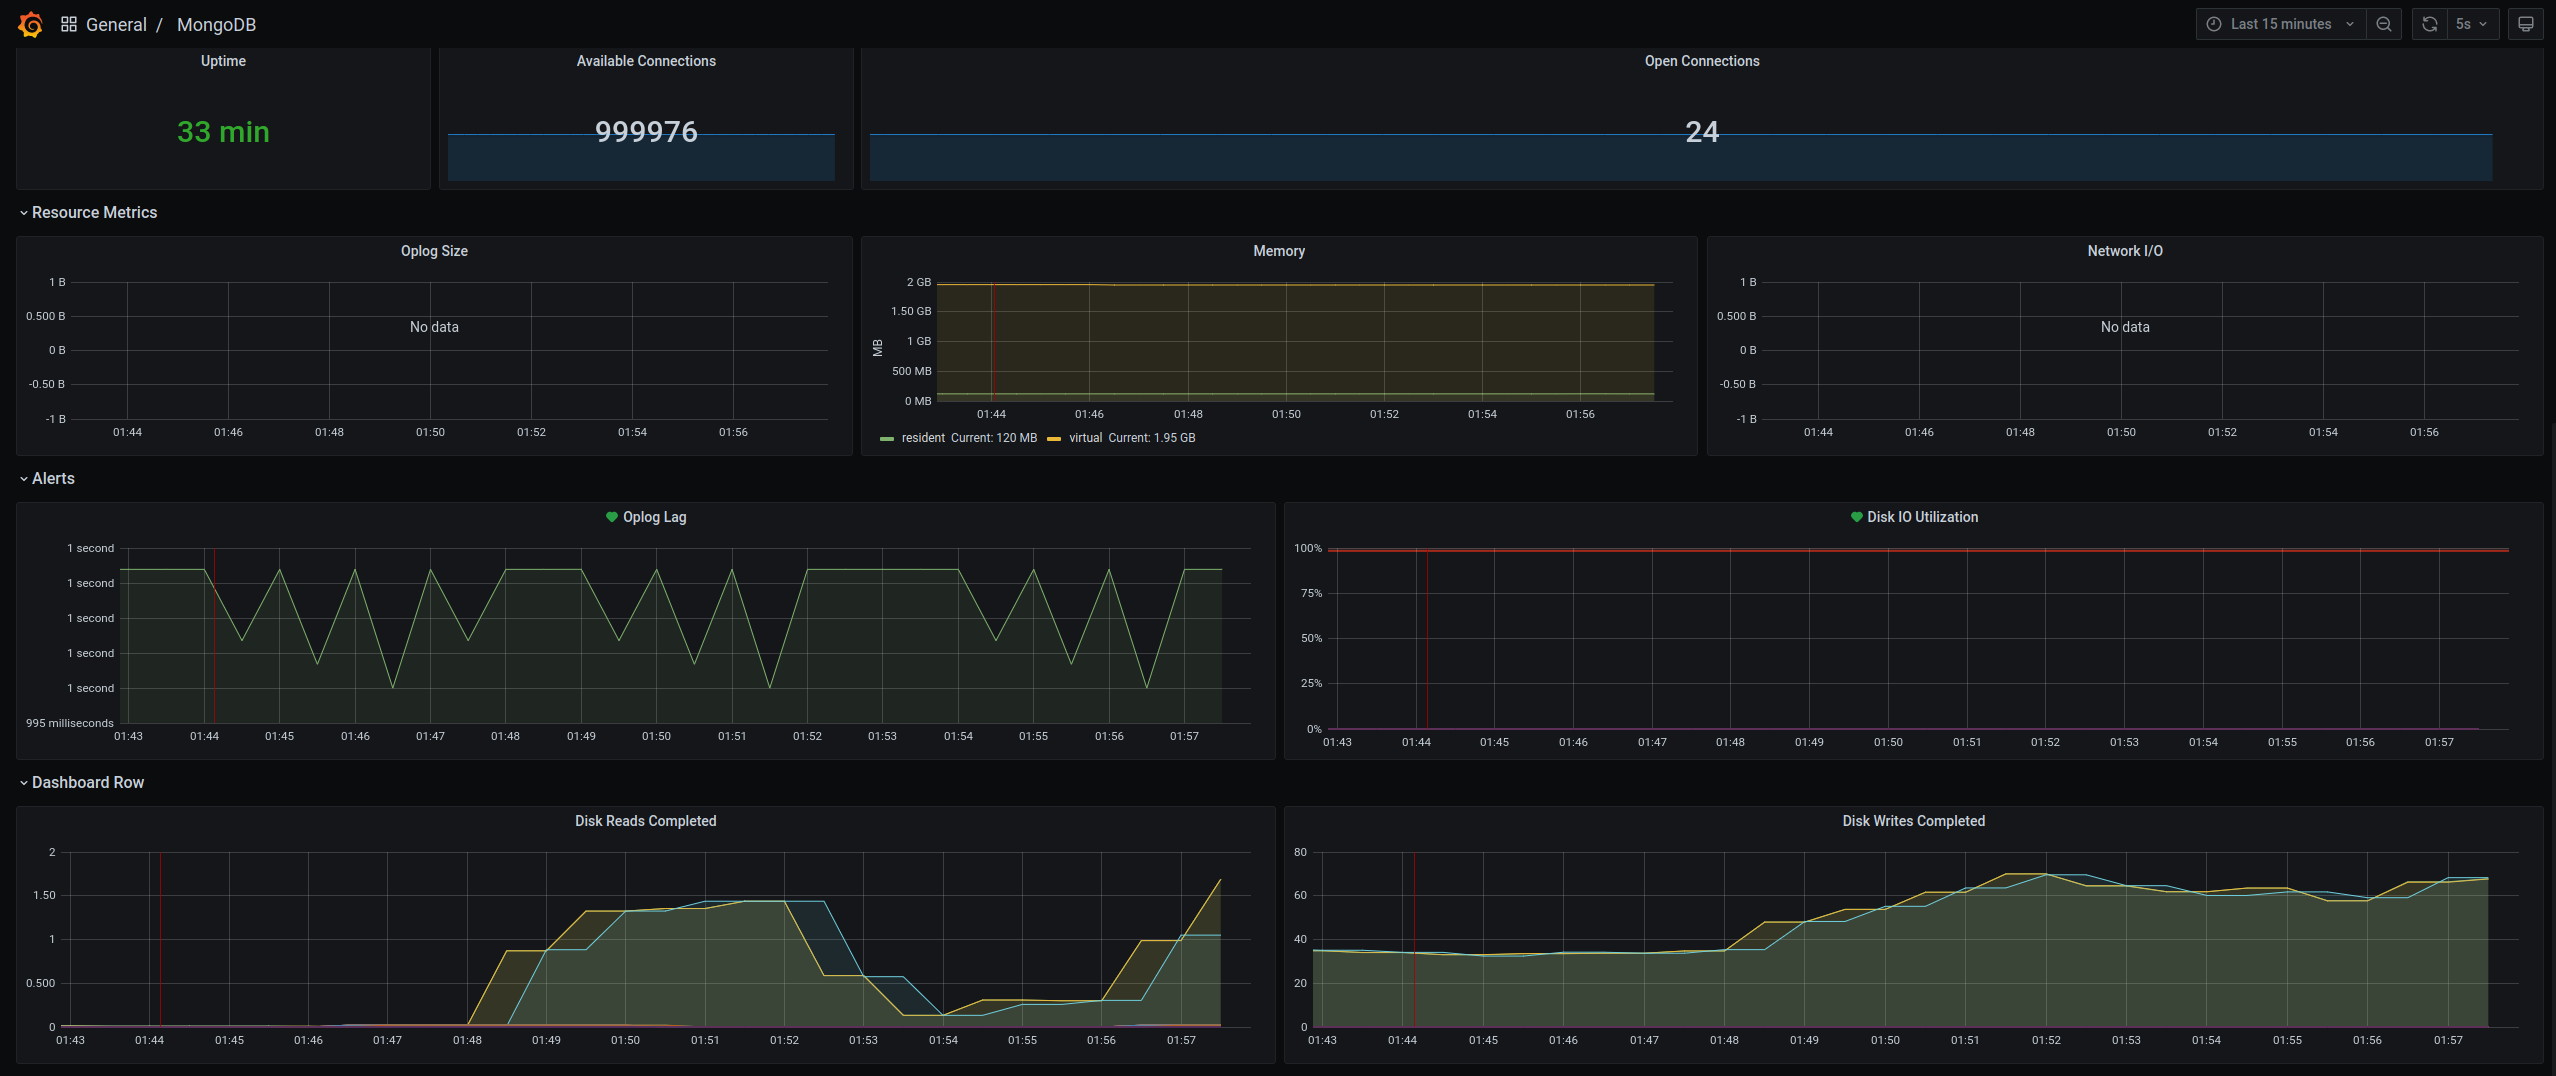
MongoDB Prometheus Exporter Dashboard. A fork inspired from https://grafana.com/grafana/dashboards/2583 which is made to work well with https://github.com/percona/mongodb_exporter.
Dependencies: Add Prometheus job to get data from mongodb cluster:
    - job_name: mongodb
      scrape_interval: 5s
      static_configs:
        - targets: ['example-mongodb-svc.mongodb:9216']
Edit statefulset adding with your informations:
You need to change someDBs with: yourDatabase.yourCollection Example: config.transactions
and
create the metrics-user with permissions to get the necessary information from your database.
- name: mongodb-exporter
  image: bitnami/mongodb-exporter:0.20.6
  command: ["/bin/sh"]
  args: ["-c", '/opt/bitnami/mongodb-exporter/bin/mongodb_exporter --discovering-mode --mongodb.indexstats-colls=someDBs --mongodb.collstats-colls=someDBs --web.listen-address=":9216" --web.telemetry-path="/metrics" --mongodb.direct-connect=false --mongodb.uri="mongodb://${DBUSER}:${DBPASS}@${DBURL}/admin?ssl=false"']
  imagePullPolicy: Always
  env:
    - name: DBURL
      value: "localhost:27017"
    - name: DBUSER
      value: "metrics-user"
    - name: DBPASS
      valueFrom:
        secretKeyRef:
          name: metrics-user
          key: password
  ports:
  - name: metrics
    containerPort: 9216
    protocol: TCP
  resources:
    limits:
      cpu: "500m"
      memory: 800M
    requests:
      cpu: "500m"
      memory: 500M
  securityContext:
    allowPrivilegeEscalation: false
Data source config
Collector type:
Collector plugins:
Collector config:
Revisions
Upload an updated version of an exported dashboard.json file from Grafana
| Revision | Description | Created | |
|---|---|---|---|
| Download |
MongoDB
Easily monitor MongoDB, a general purpose, document-based, distributed database, with Grafana Cloud's out-of-the-box monitoring solution.
Learn more