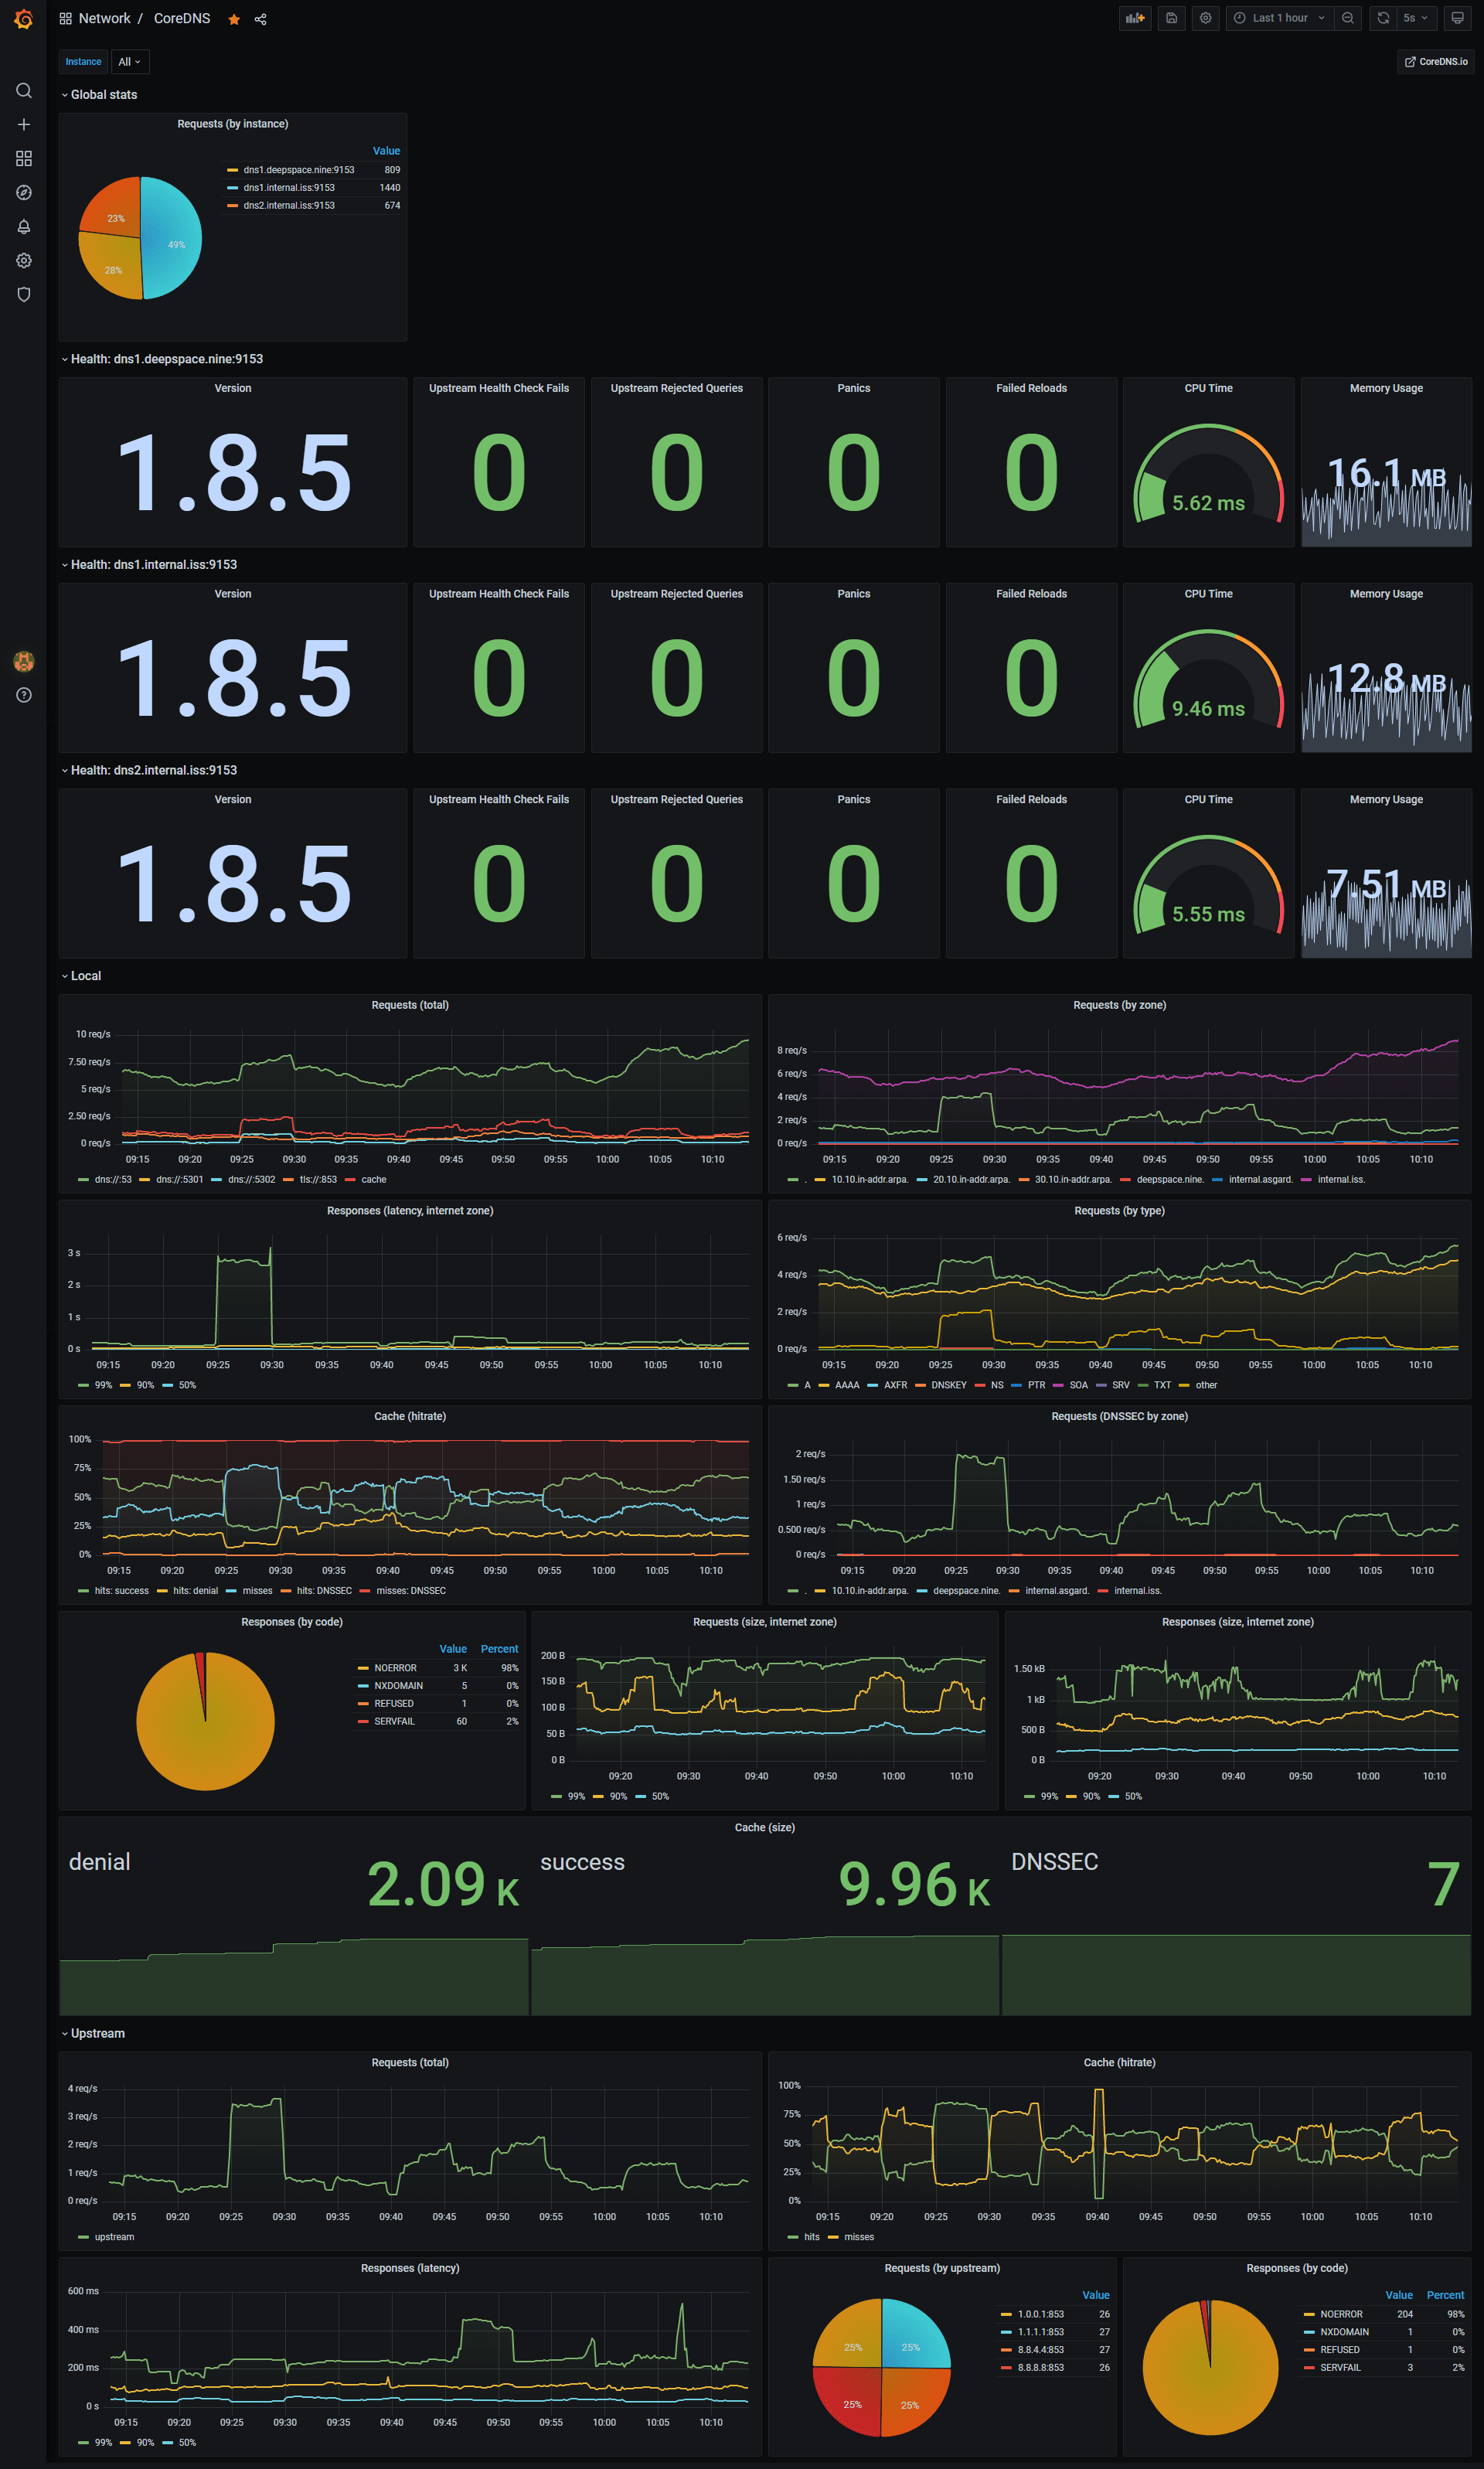
CoreDNS
A dashboard for the CoreDNS DNS server with updated metrics for version 1.7.0+. Based on the CoreDNS 1.7.0+ dashboard by ejkinger
A recommended modification for your own dashboard
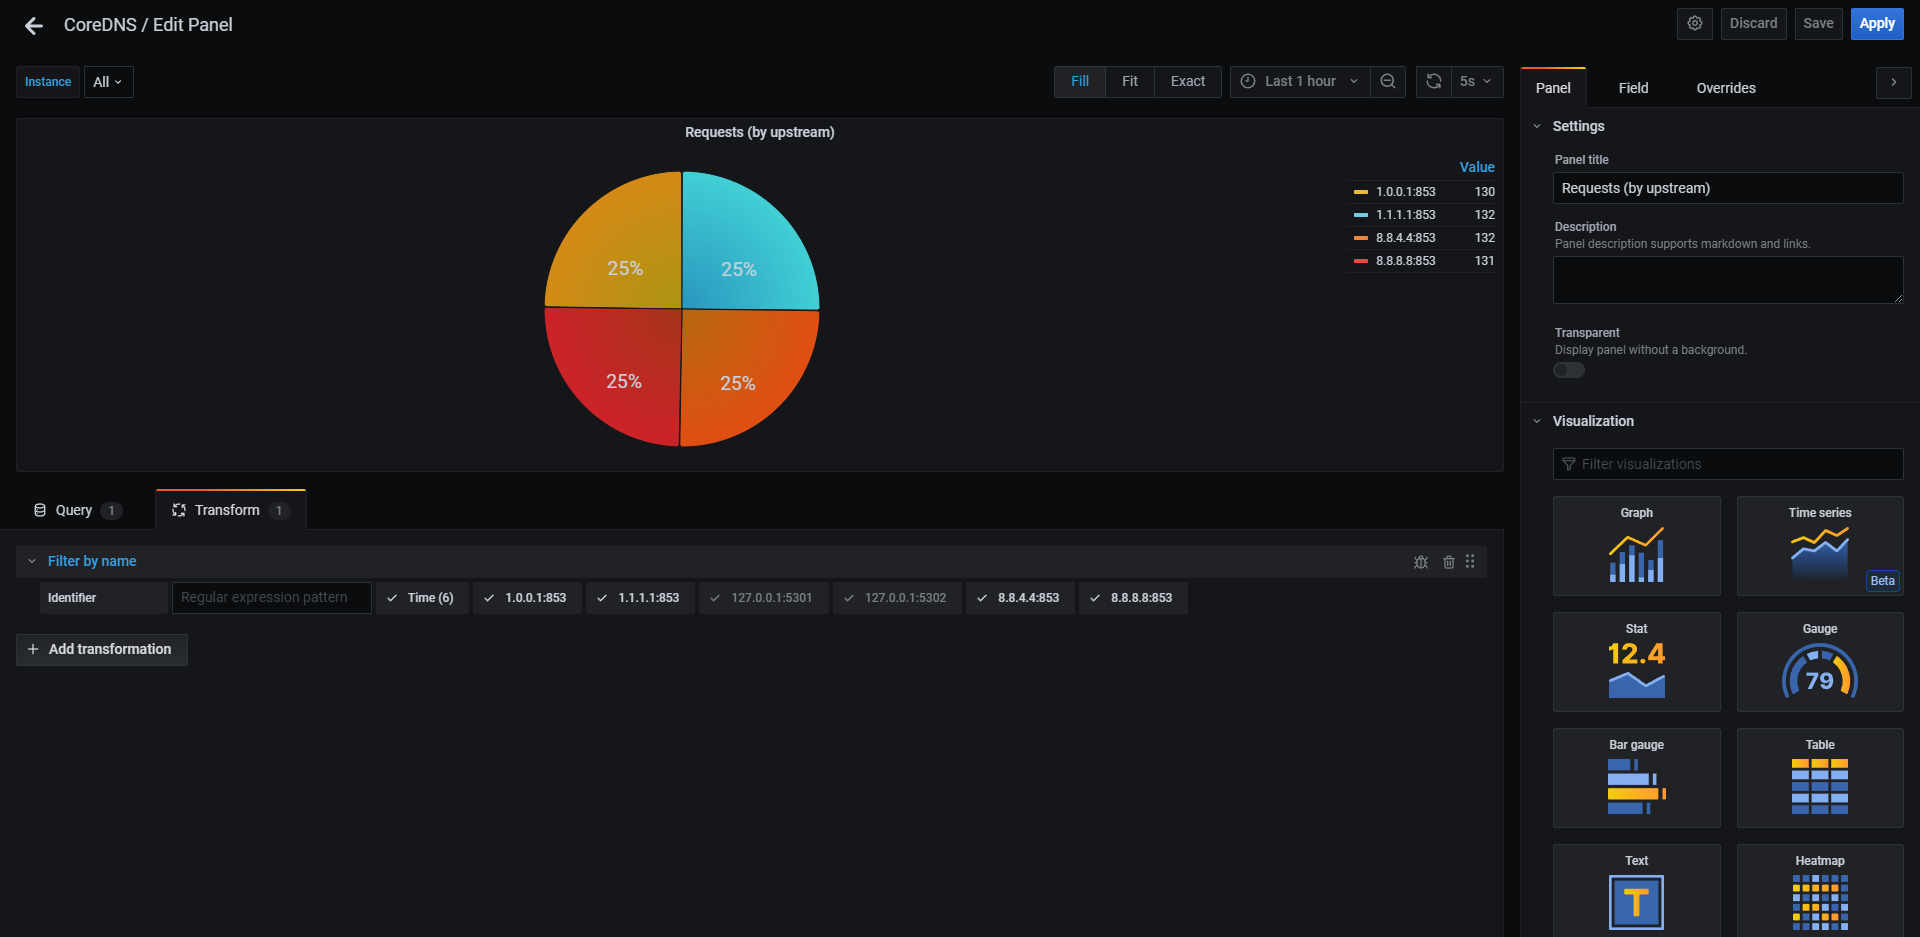
The "Requests (upstream)" piechart should be modified to fit your needs. Edit the panel, go to the "Transform" tab, and exclude (or re-include) any DNS servers from the pie chart that you wish. This is shown in the last screenshot.
Updates
Update 09/26/21
- Fixed "Cache (hitrate)" panel
- Updated graphs to no longer use "missed" metrics
Data source config
Collector type:
Collector plugins:
Collector config:
Revisions
Upload an updated version of an exported dashboard.json file from Grafana
| Revision | Description | Created | |
|---|---|---|---|
| Download |
CoreDNS
Monitor CoreDNS with Grafana. Easily keep tabs on your DNS server with Grafana Cloud's out-of-the-box monitoring solution.
Learn more