Sekawan Media - Monitoring System With Docker Container
Monitoring server untuk docker host, mysql dan nginx
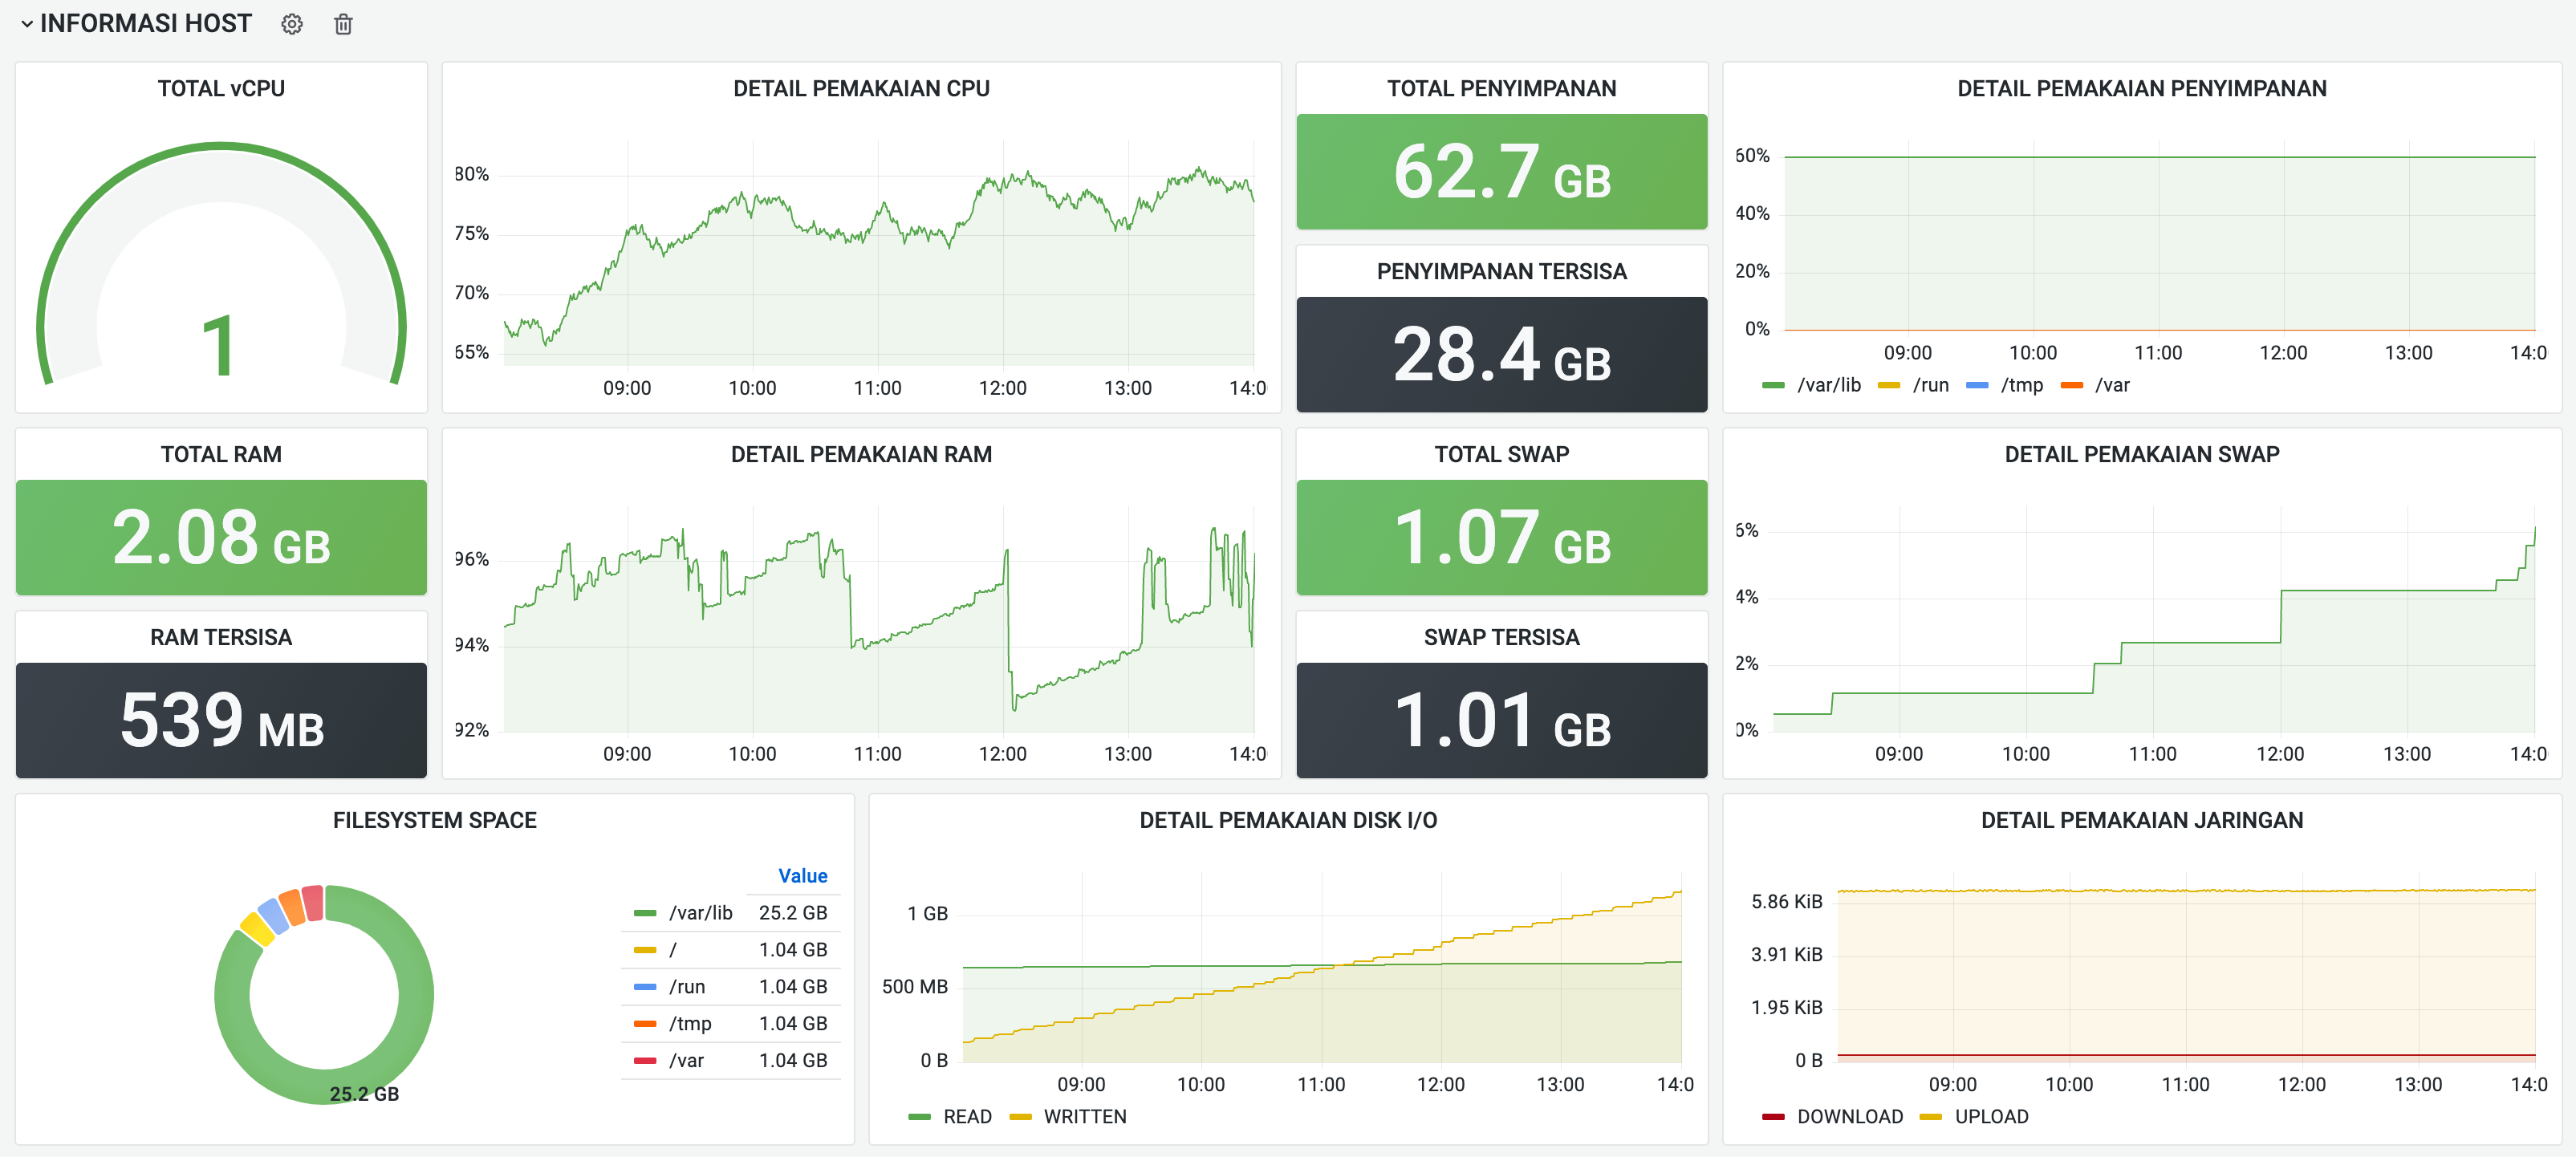
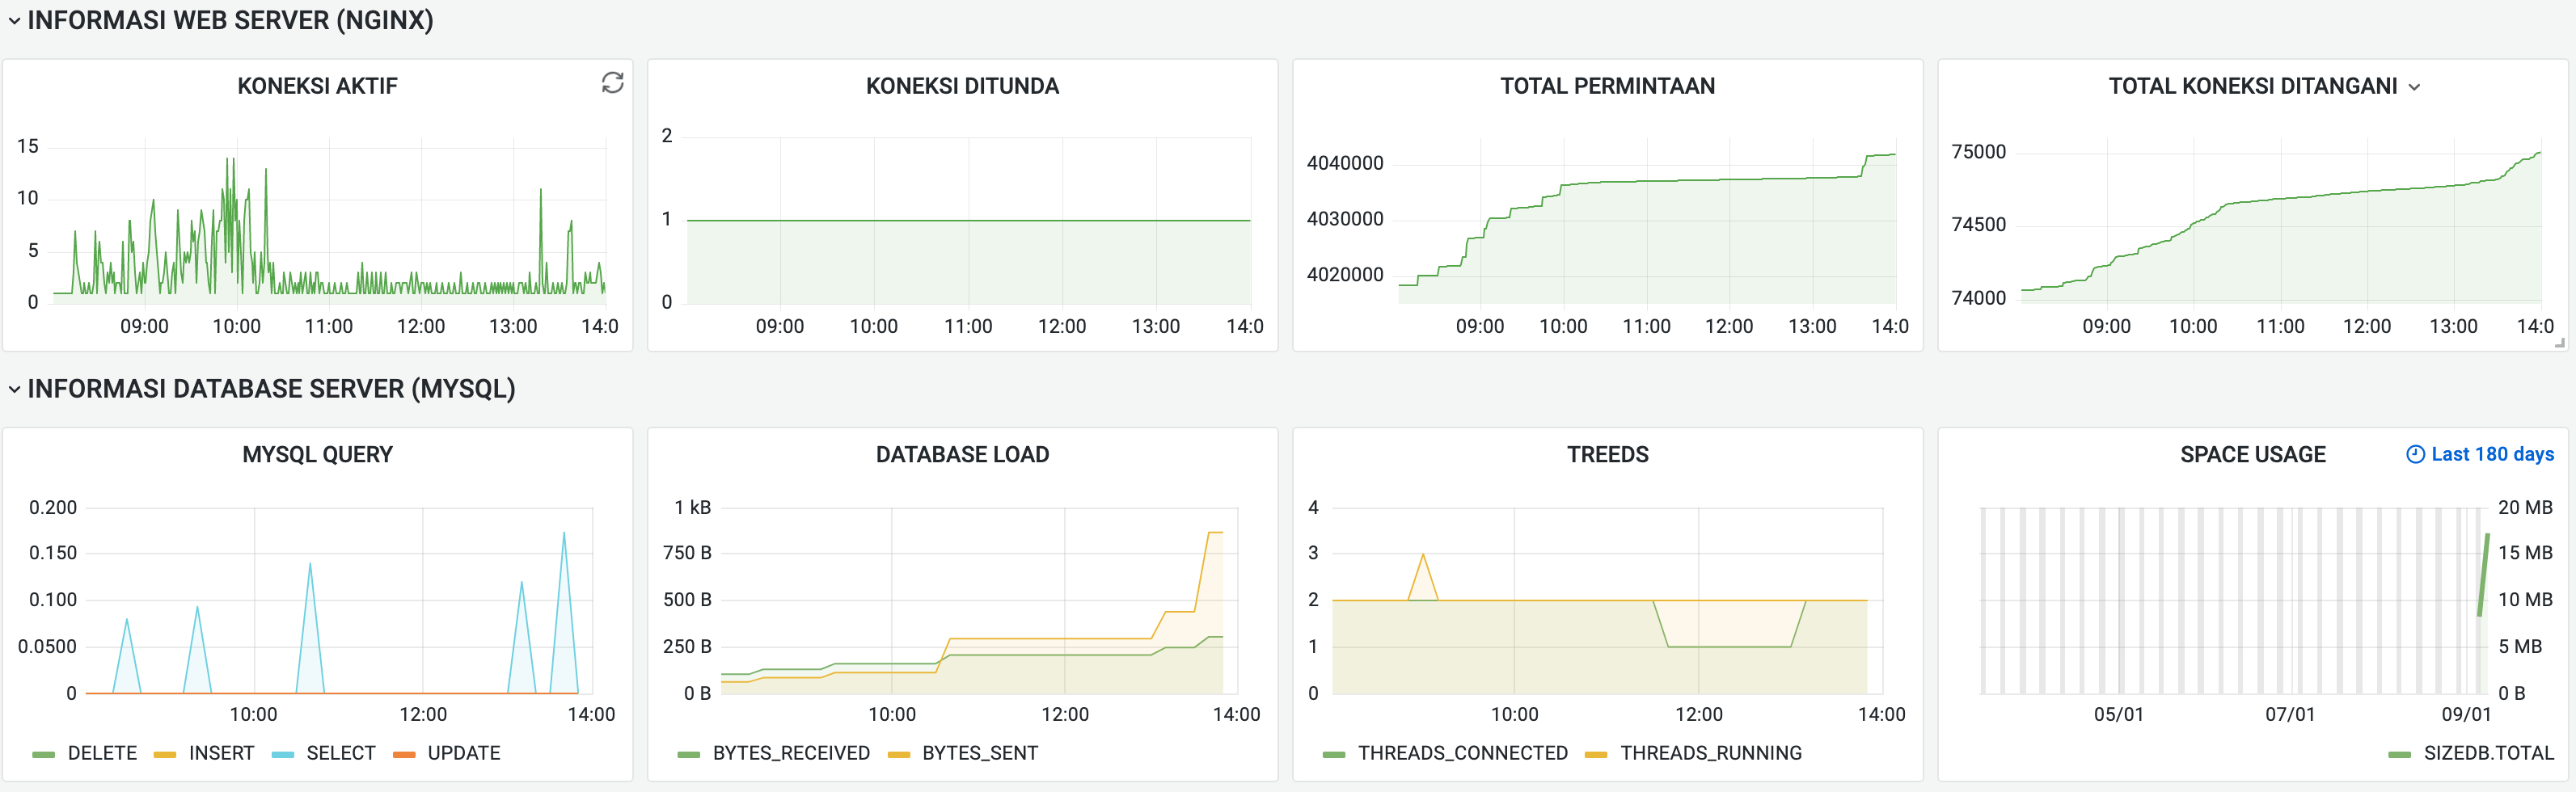
The Sekawan Media - Monitoring System With Docker Container dashboard uses the mysql and prometheus data sources to create a Grafana dashboard with the gauge, graph, piechart, stat and timeseries panels.
Data source config
Collector type:
Collector plugins:
Collector config:
Revisions
Upload an updated version of an exported dashboard.json file from Grafana
| Revision | Description | Created | |
|---|---|---|---|
| Download |
Docker
Easily monitor Docker with Grafana Cloud's out-of-the-box monitoring solution.
Learn more