
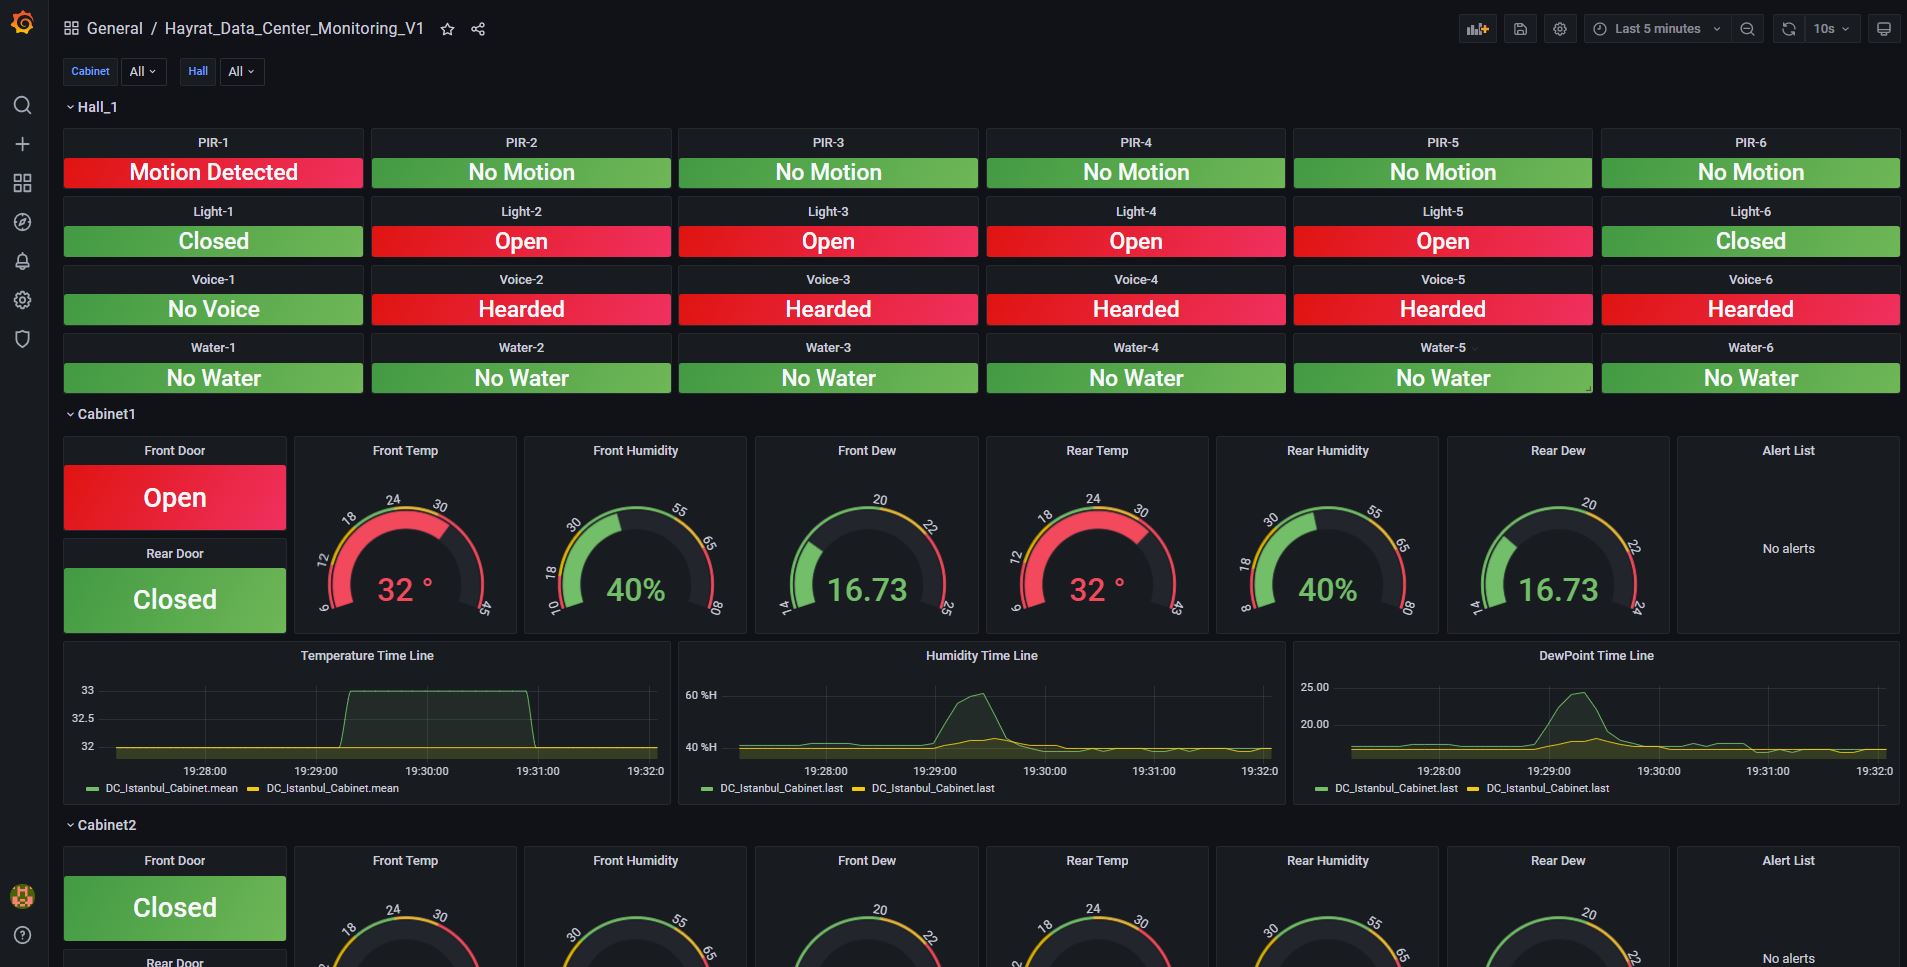
Hayrat Data Center Monitoring
Data Center Temperature, Humidity, DewPoint, Cabinet Door Access, Voice, Light and Water Sensor Monitoring on Grafana Dashboard.
Hayrat Data Center Monitoring
Data Center Temperature, Humidity, DewPoint, Cabinet Door Access, Voice, Light and Water Sensor Monitoring on Grafana Dashboard. This project is the cheapest monitoring solution in the world. :) It can be scalable using multiple base units and aggregate in a central database. Different sensors can be added and Thousands of sensors can be tracked. Have a good time!
GitHub: https://github.com/oguzhantanir/Hayrat_Data_Center_Monitoring
Software Requirements
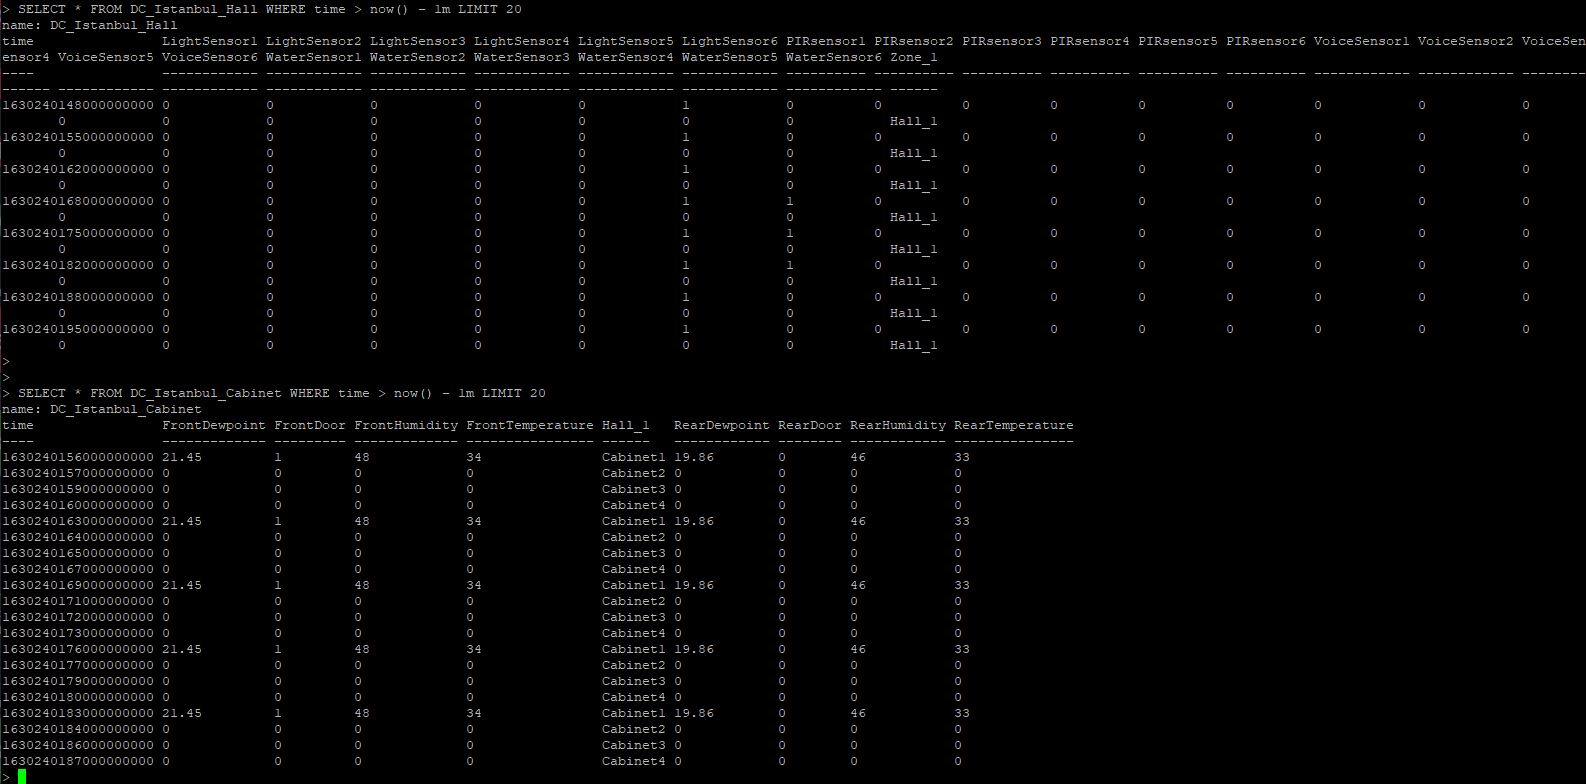
- InfluxDB (Time Series Database)
- Grafana (Dashboard)
Components And Supplies
- Arduino Mega 2560
- ENC28J60 Network Module
- DHT11 Sensor
- HC-SR501 Motion Sensor
- Lever Switch
- LDR Light Sensor
- Sound Sensor
- Water Sensor
Optional
- LCD I2C 16x2
Arduino Libraries
- EthernetENC (https://github.com/jandrassy/EthernetENC) We used this library because it uses less memory. Alternatively you can use UIPEthernet library.
- LiquidCrystal_I2C (https://github.com/johnrickman/LiquidCrystal_I2C) If you use the LCD should be used this library. (Not required)
- DHT11 (https://github.com/oguzhantanir/Hayrat_Data_Center_Monitoring/tree/main/DHT11)
Alternative ENC28J60 Library
- UIPEthernet (https://github.com/UIPEthernet/UIPEthernet)
Data source config
Collector type:
Collector plugins:
Collector config:
Dashboard revisions
Upload an updated version of an exported dashboard.json file from Grafana
| Revision | Decscription | Created | |
|---|---|---|---|
| Download |
Sign up for Grafana Cloud

Get up and running in minutes with the Grafana Cloud free tier, which includes free forever 10k metrics, 50GB logs, 50GB traces, 500 VUh, and more.
Get this dashboard
Data source:
Dependencies: