Mikrotik SWOS
Mikrotik switchos snmp monitoring
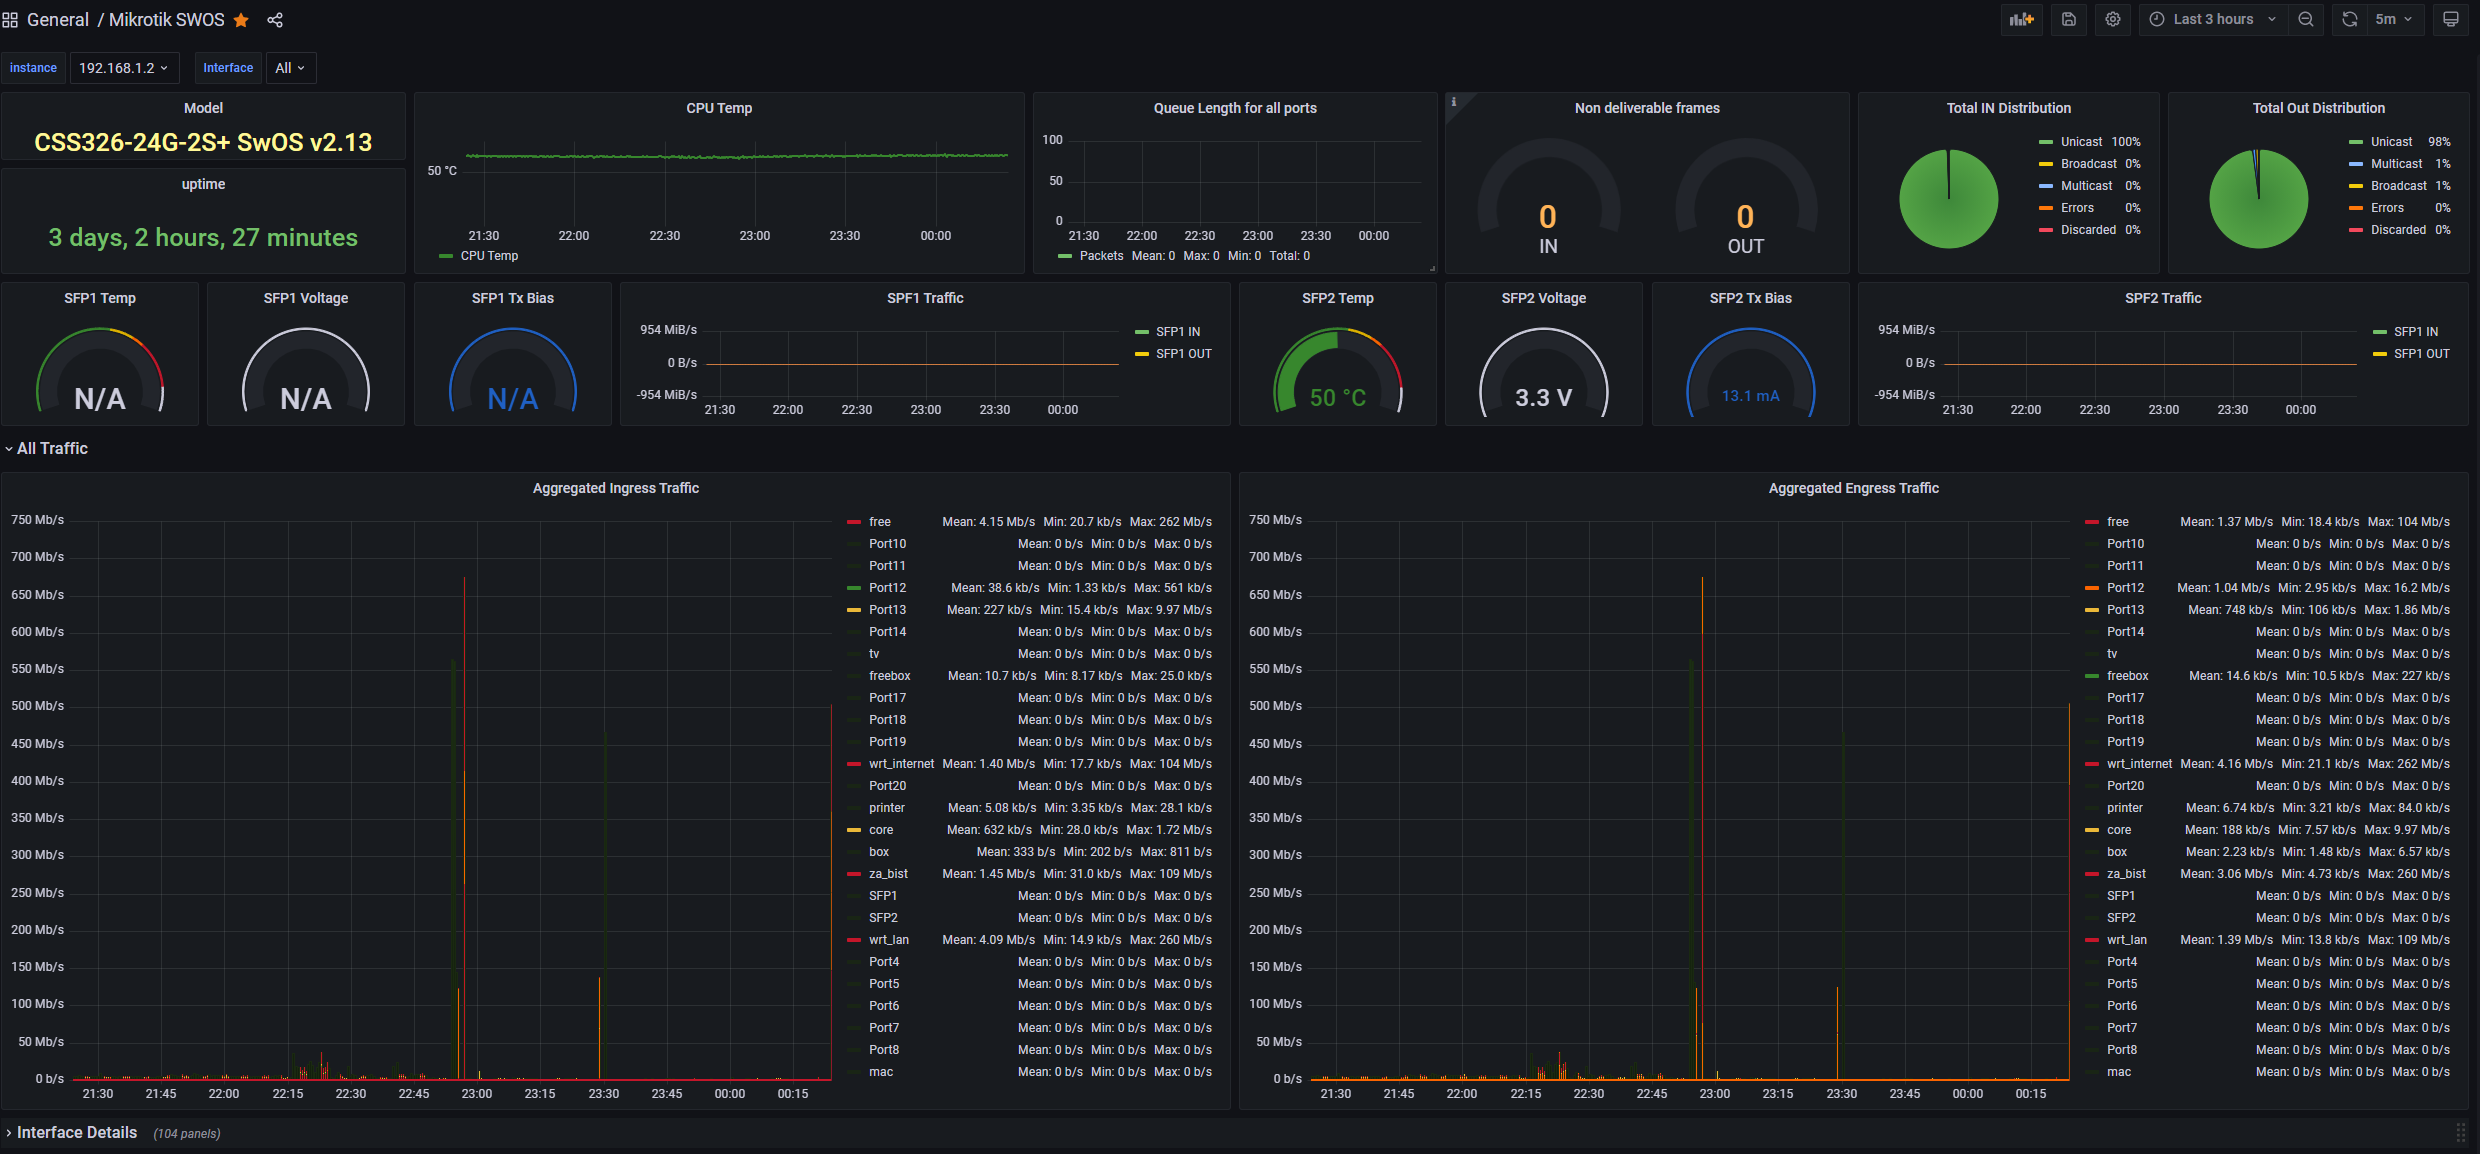
It's a Dashboard built specifically for Mikrotik's SWOS. It has been adapted from multiple RouterOS Dashboards here. This is not a dashboard for RouterOS - it's only the switching part
I use the SNMP_exporter running on the same machine as my Prometheus to gather the data from the switch via... SNMP, duh!. Use it with the module=mikrotik & target=Your_switch_IP_Address
I only tested it with my switch (model and version in screenshots). The only Hard-Coded info in the dashboard are the two optical interface panels. Change the interface id or just remove them completely if you have a different model. Other than that it's basically Plug and play. Might even work with other switches.
Latest version fressssshhhh from the oven!
- Changelog - Bugfixes and overall functionality improvements
Data source config
Collector config:
Upload an updated version of an exported dashboard.json file from Grafana
| Revision | Description | Created | |
|---|---|---|---|
| Download |


