
Nginx
Grafana Dashboard for Nginx Web Server.
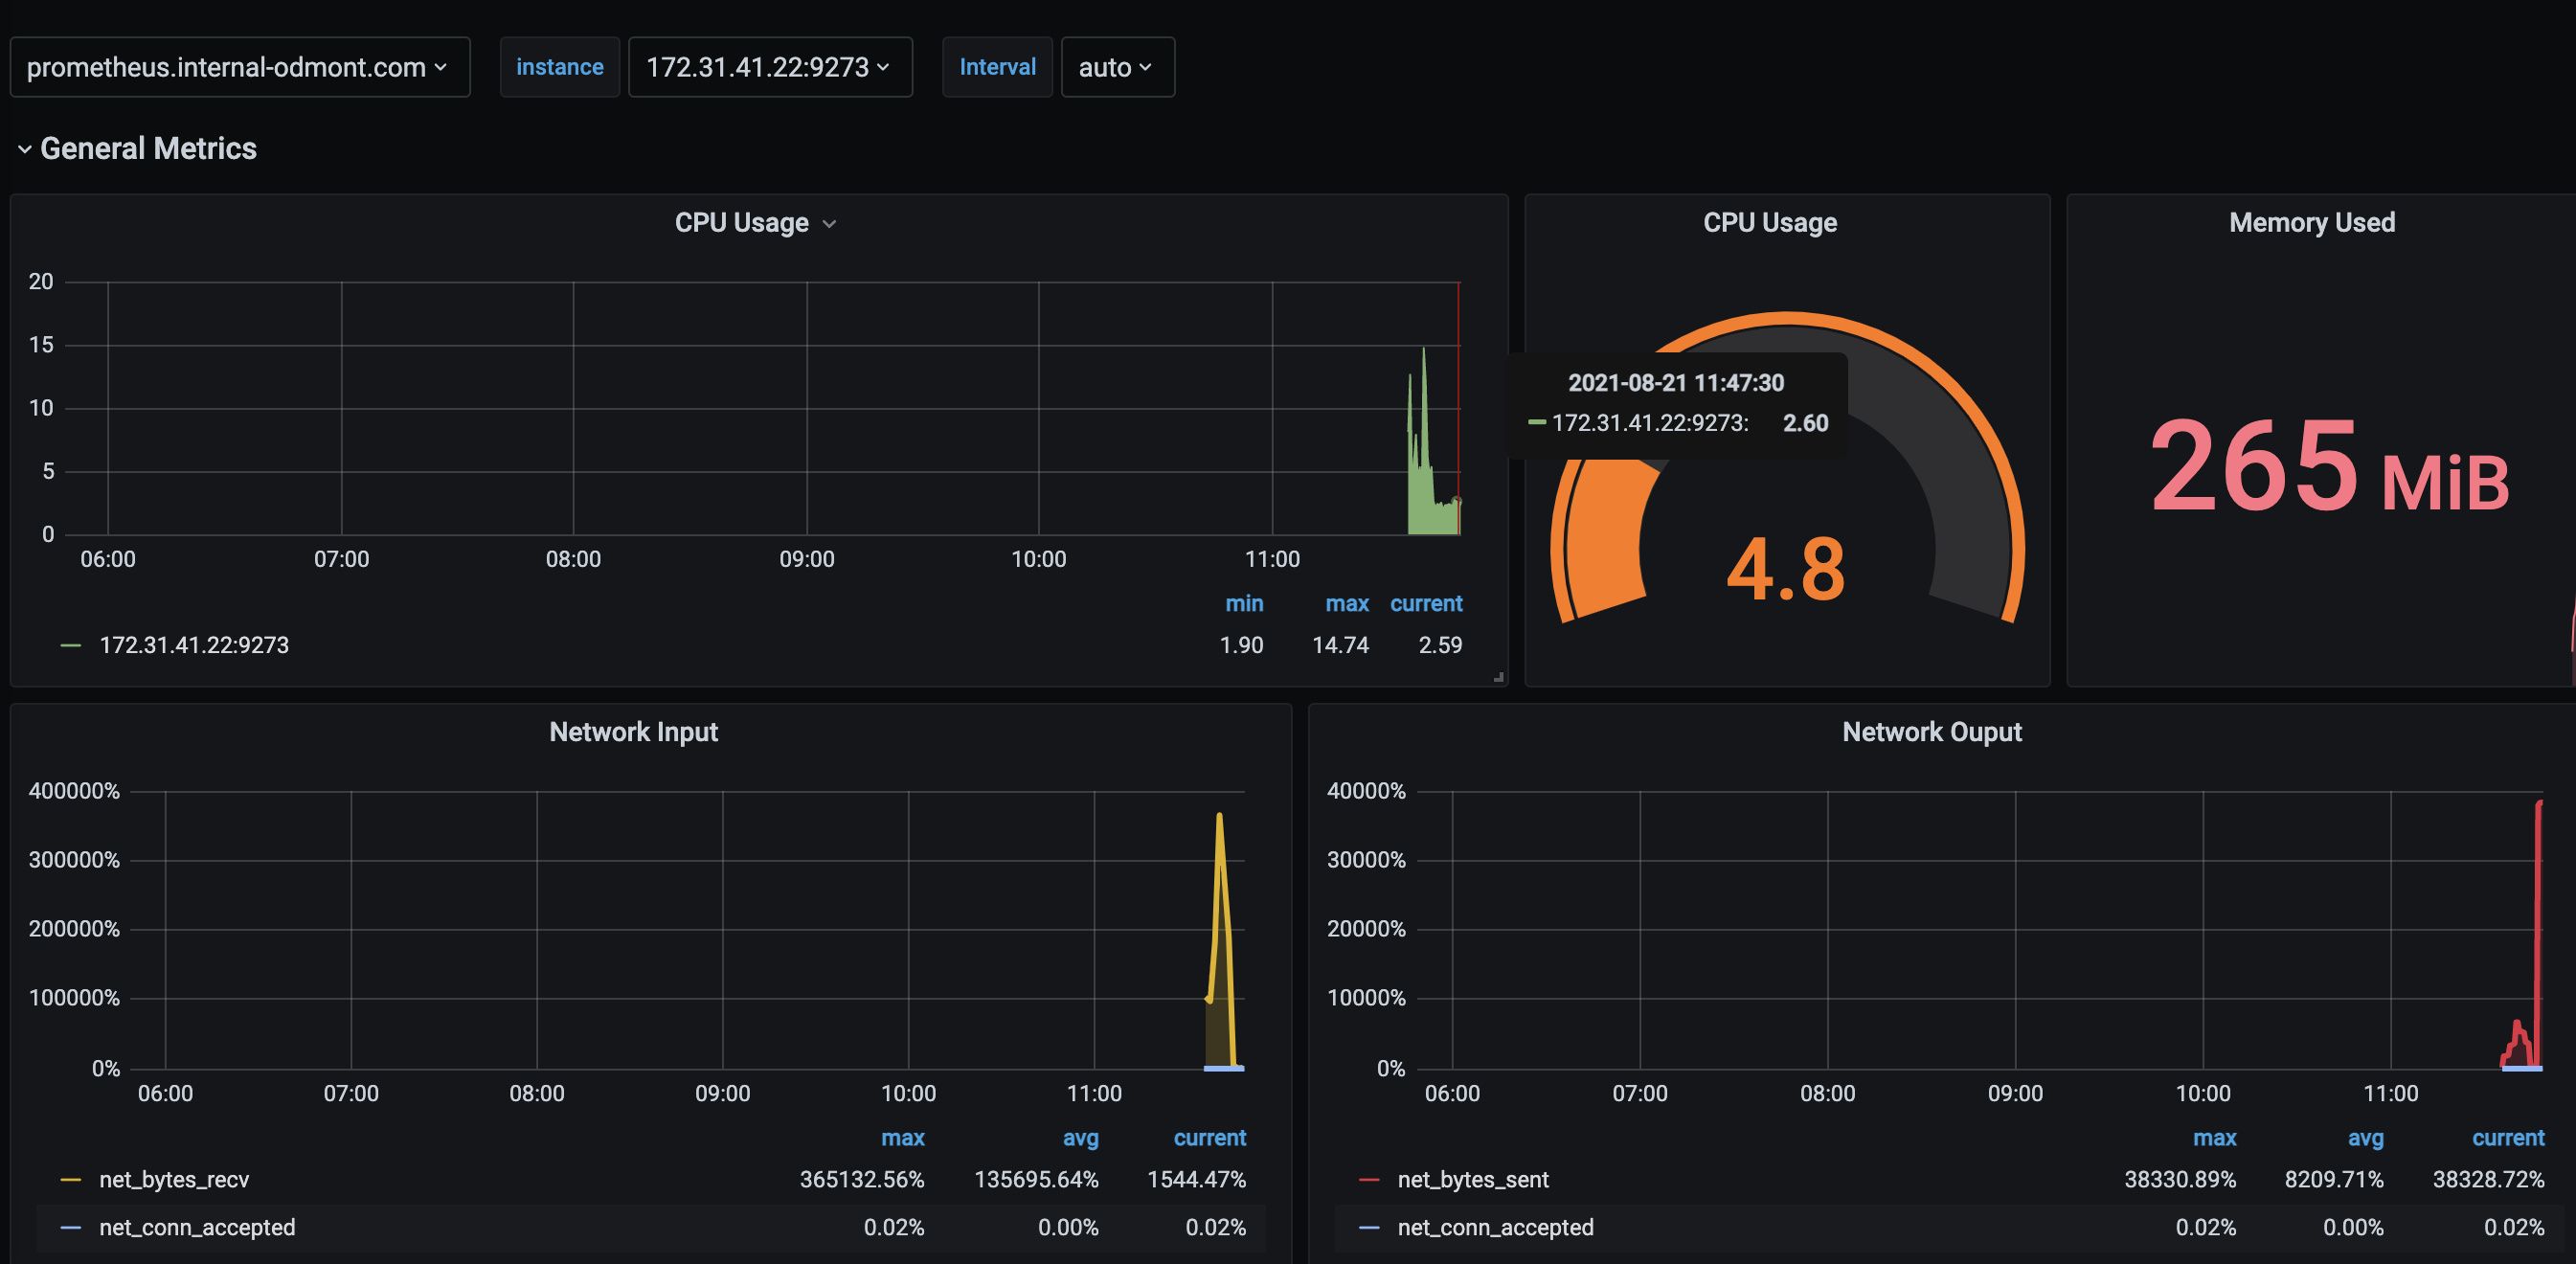
Dashboard for Nginx Web Server.
Dependencies
- Change the permission of the log file. Usually access log file can be found at
/var/log/nginx/access/log. You can also find the path of the access log file in nginx.conf(Nginx Configuration file) file. Provide the path in the tail plugin of Telegraf. - Enable the sub status module in Nginx, and add the following virtual host config in Nginx Web Server
server {
	listen 81 default_server;
	listen [::]:81 default_server;

	root /var/www/html;
	index index.html index.htm index.nginx-debian.html;

	server_name _;

	location / {
		try_files $uri $uri/ =404;
	}

	location /nginx_status {
        	stub_status;
        	allow 127.0.0.1;
        	deny all;
        }
}
Following the metrics monitor through the dashboard
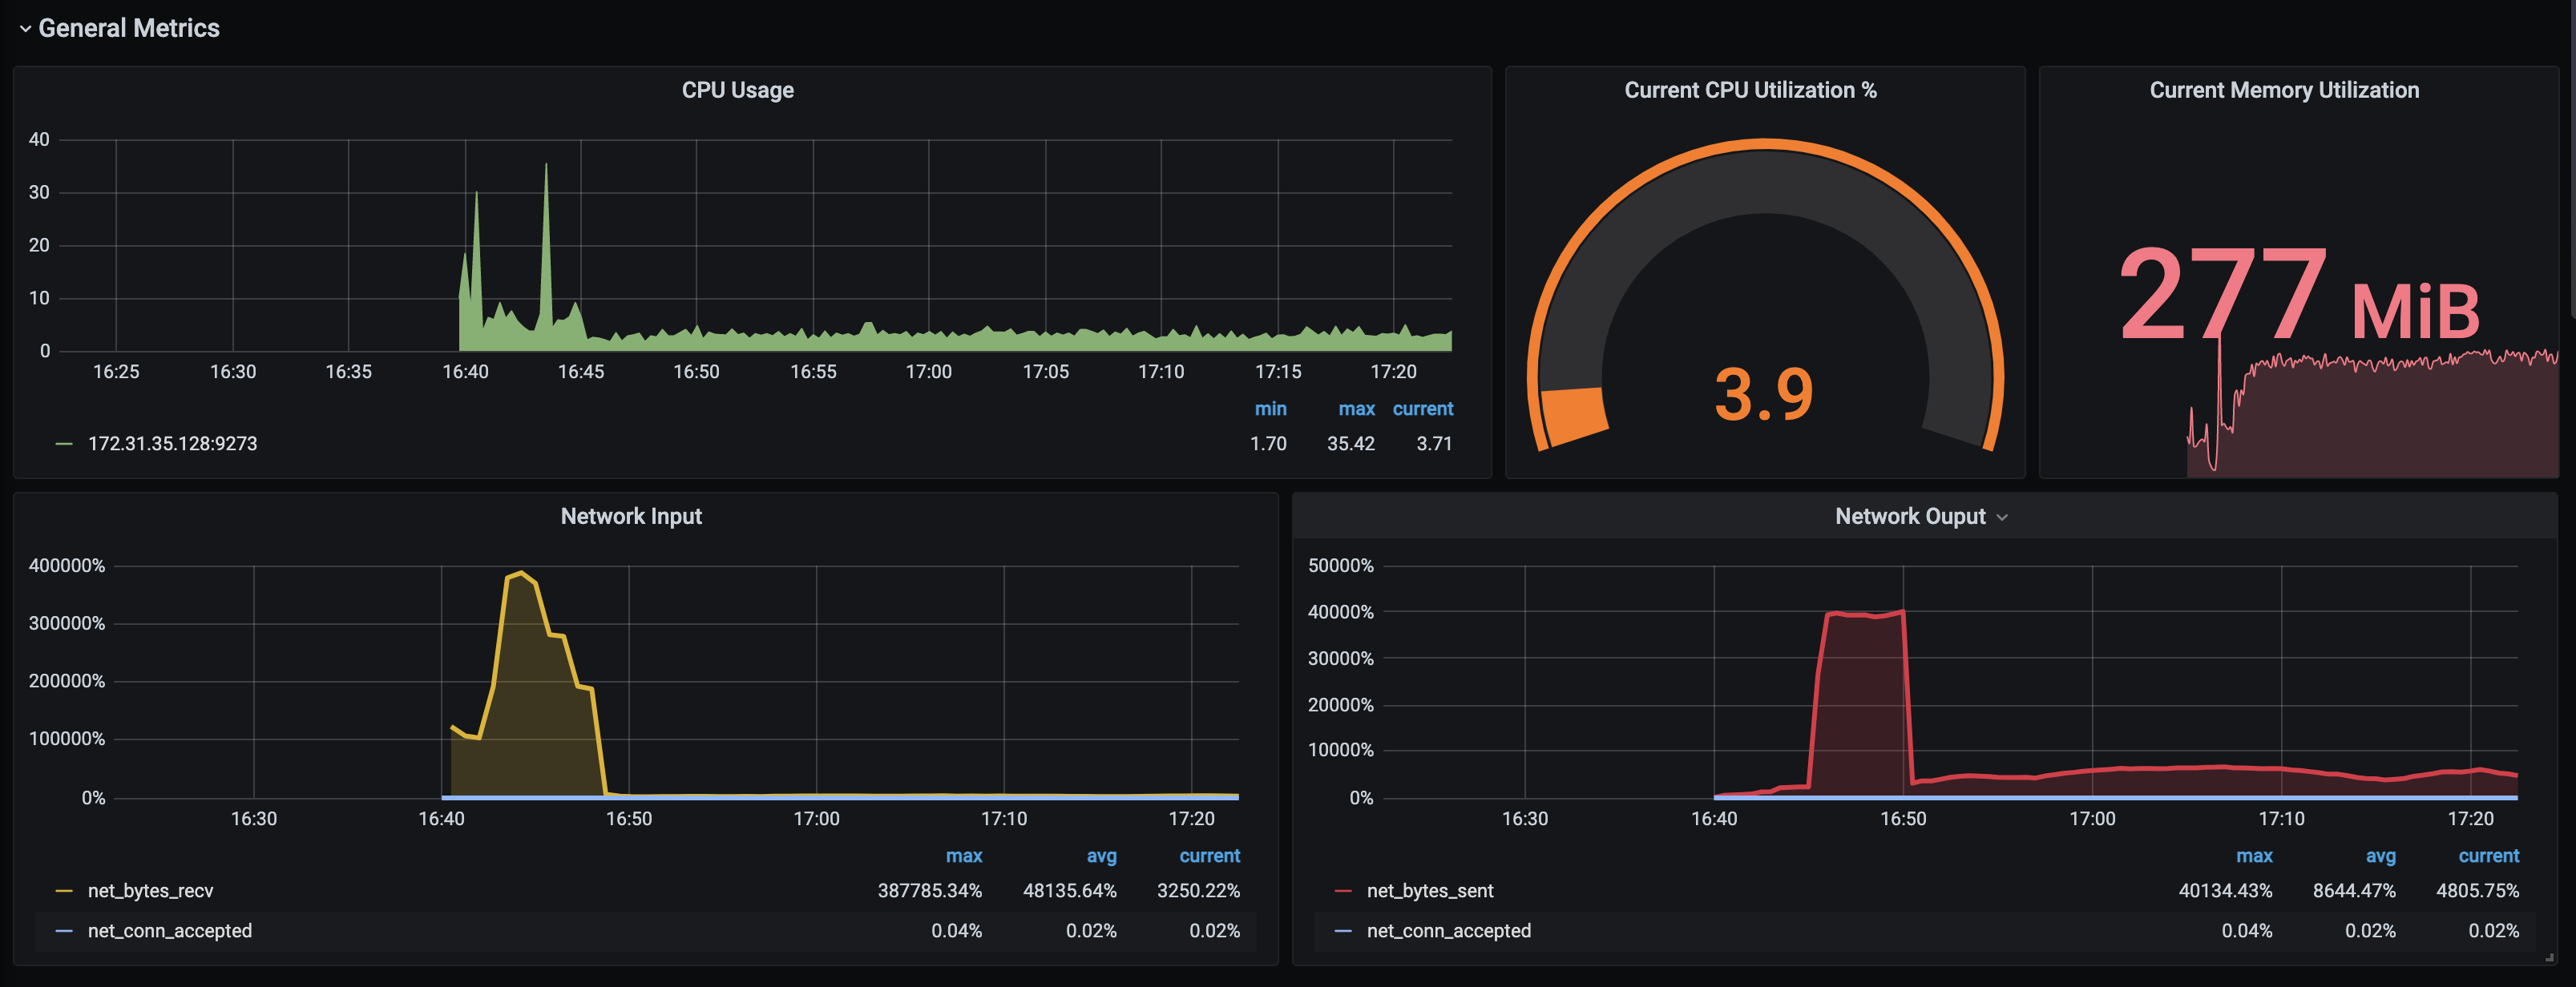
- CPU Usage
- Current CPU Utilization %
- Current Memory Utilization
- Network Input
- Network Ouput
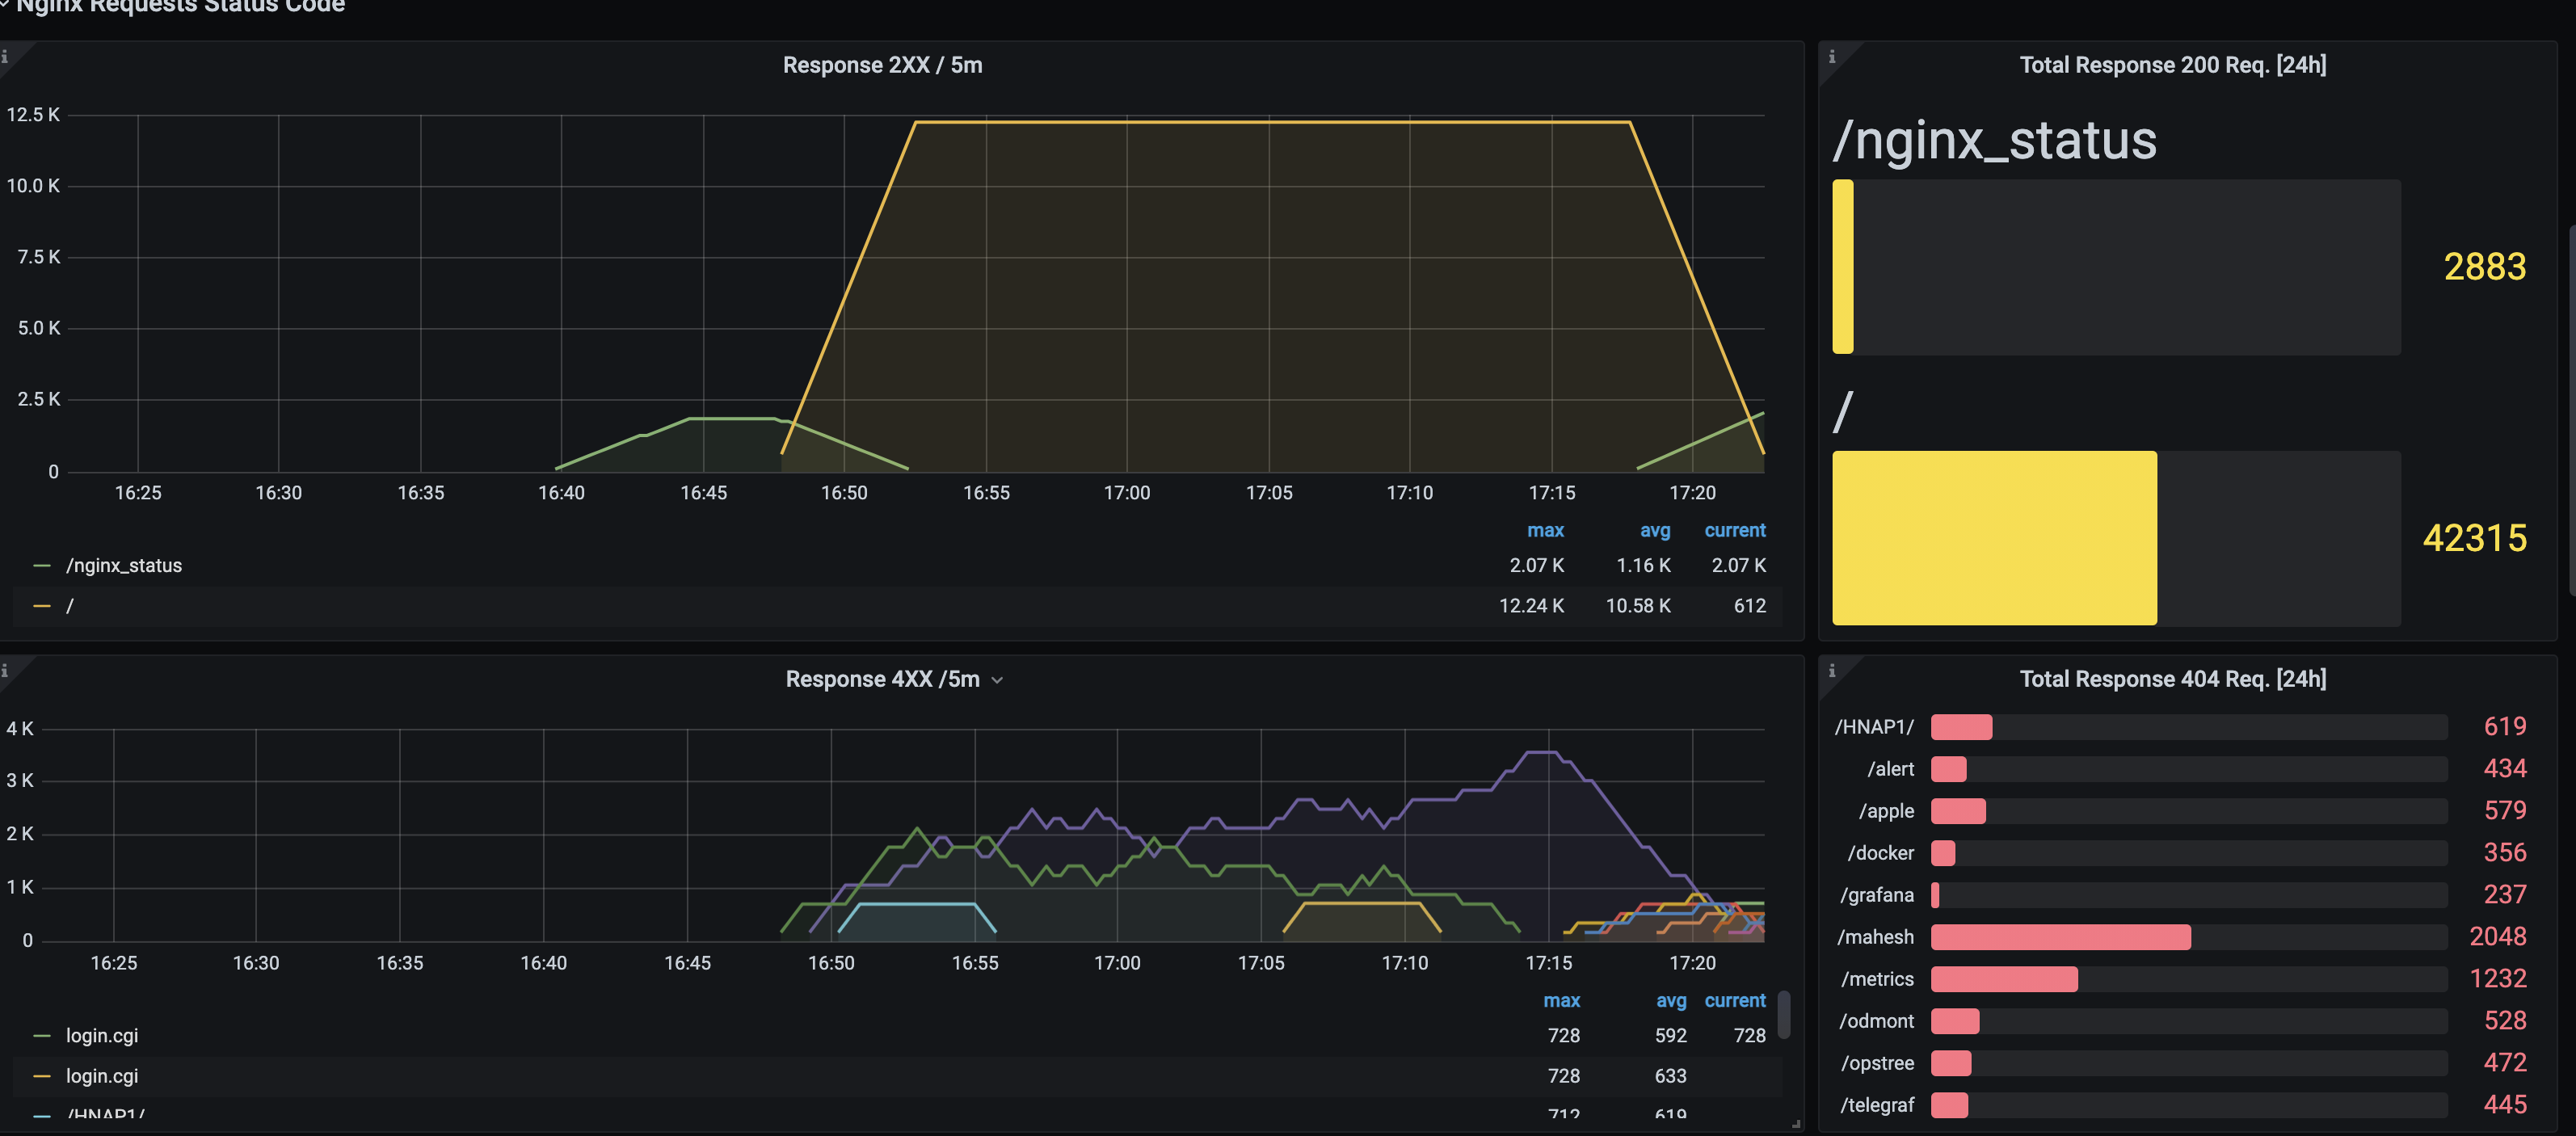
- Response 2XX / 5m
- Total Response 200 Req. [24h]
- Response 4XX /5m
- Total Response 404 Req. [24h]
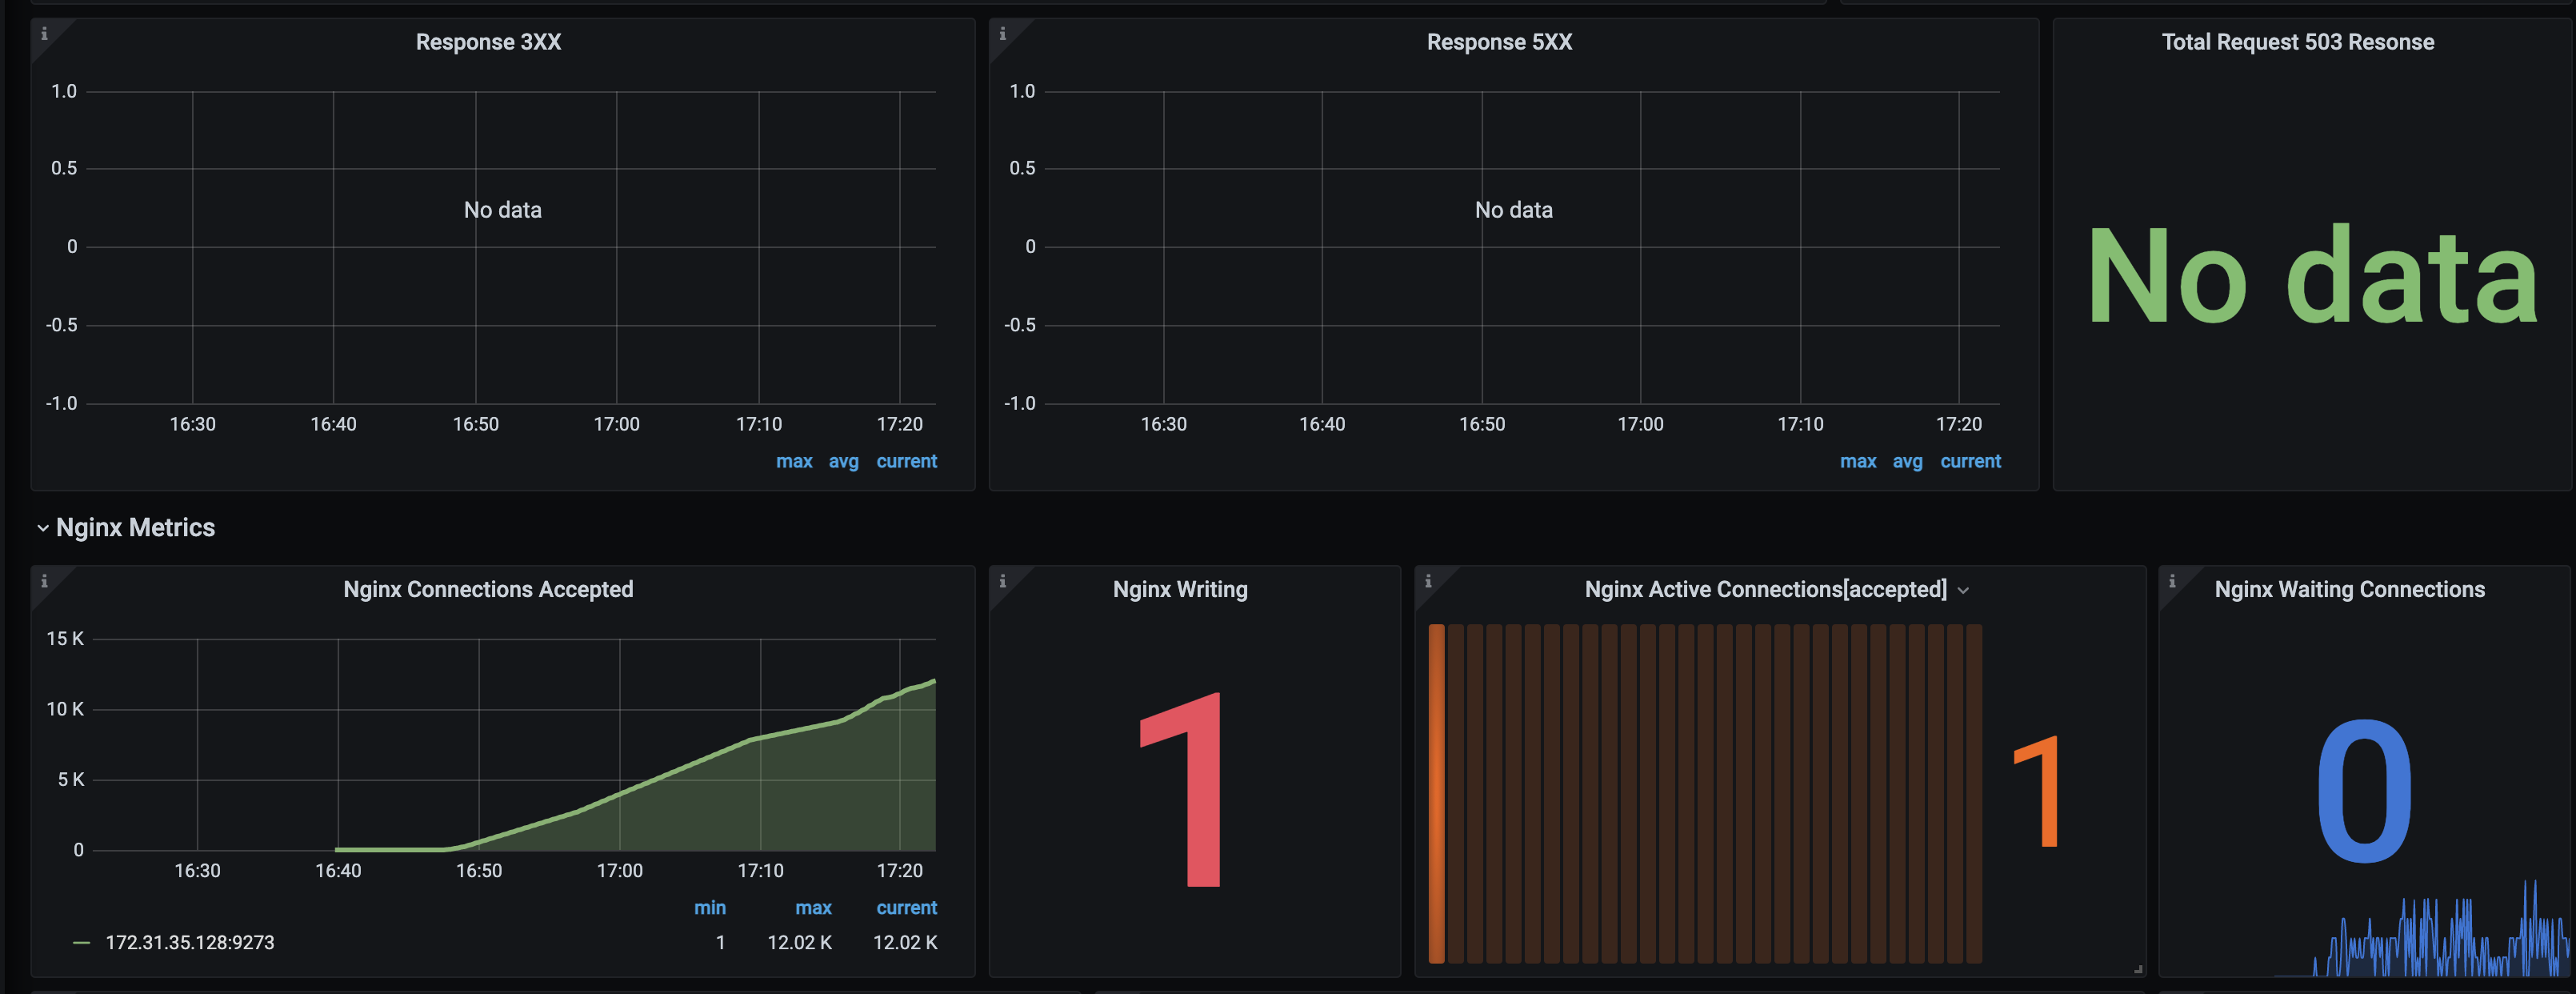
- Response 3XX
- Response 5XX
- Total Request 503 Resonse
- Nginx Connections Accepted
- Nginx Writing
- Nginx Active Connections[accepted]
- Nginx Waiting Connections
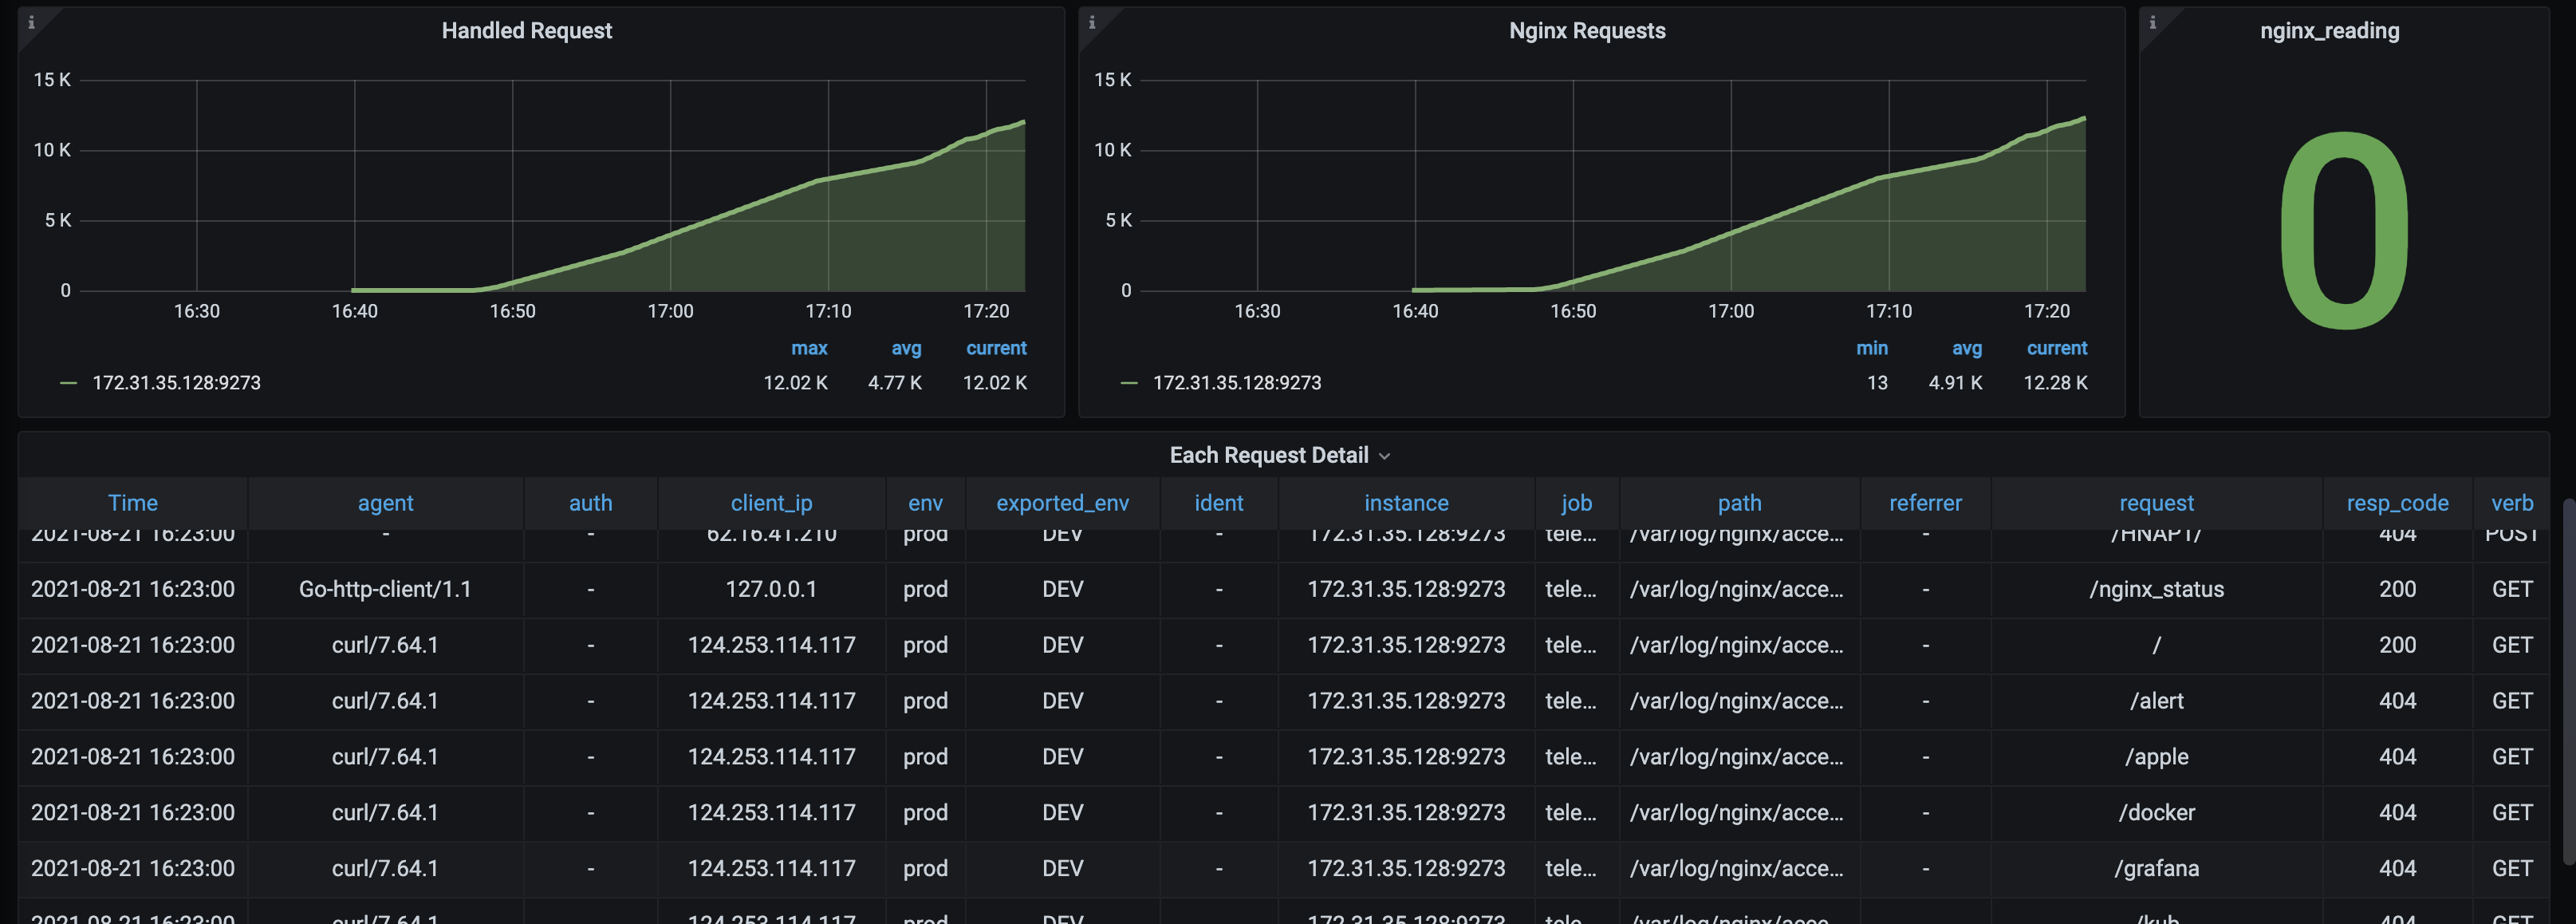
- Handled Request
- Nginx Requests
- nginx_reading
- Each Request Detail
Contributor Information
Data source config
Collector type:
Collector plugins:
Collector config:
Dashboard revisions
Upload an updated version of an exported dashboard.json file from Grafana
| Revision | Decscription | Created | |
|---|---|---|---|
| Download |
Sign up for Grafana Cloud

Get up and running in minutes with the Grafana Cloud free tier, which includes free forever 10k metrics, 50GB logs, 50GB traces, 500 VUh, and more.
Get this dashboard
Data source:
Dependencies: