
GPFS Performance
GPFS dashboard for Prometheus GPFS exporter
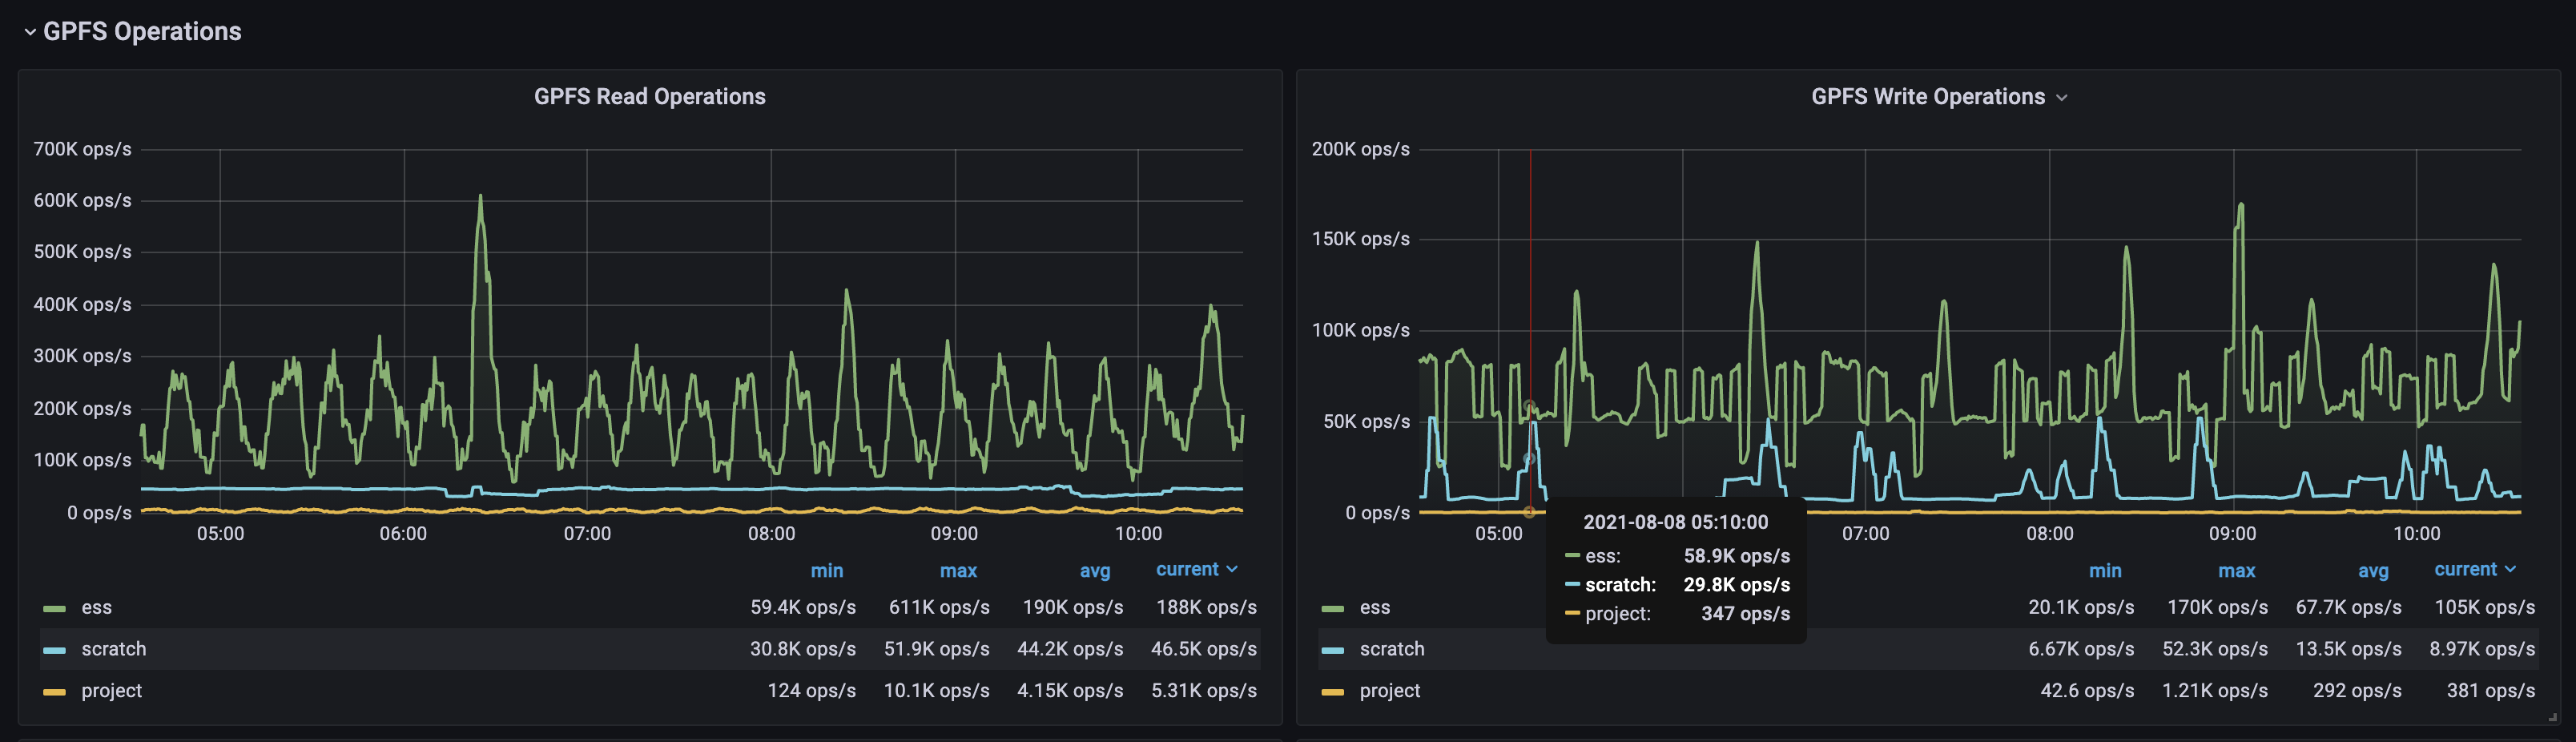
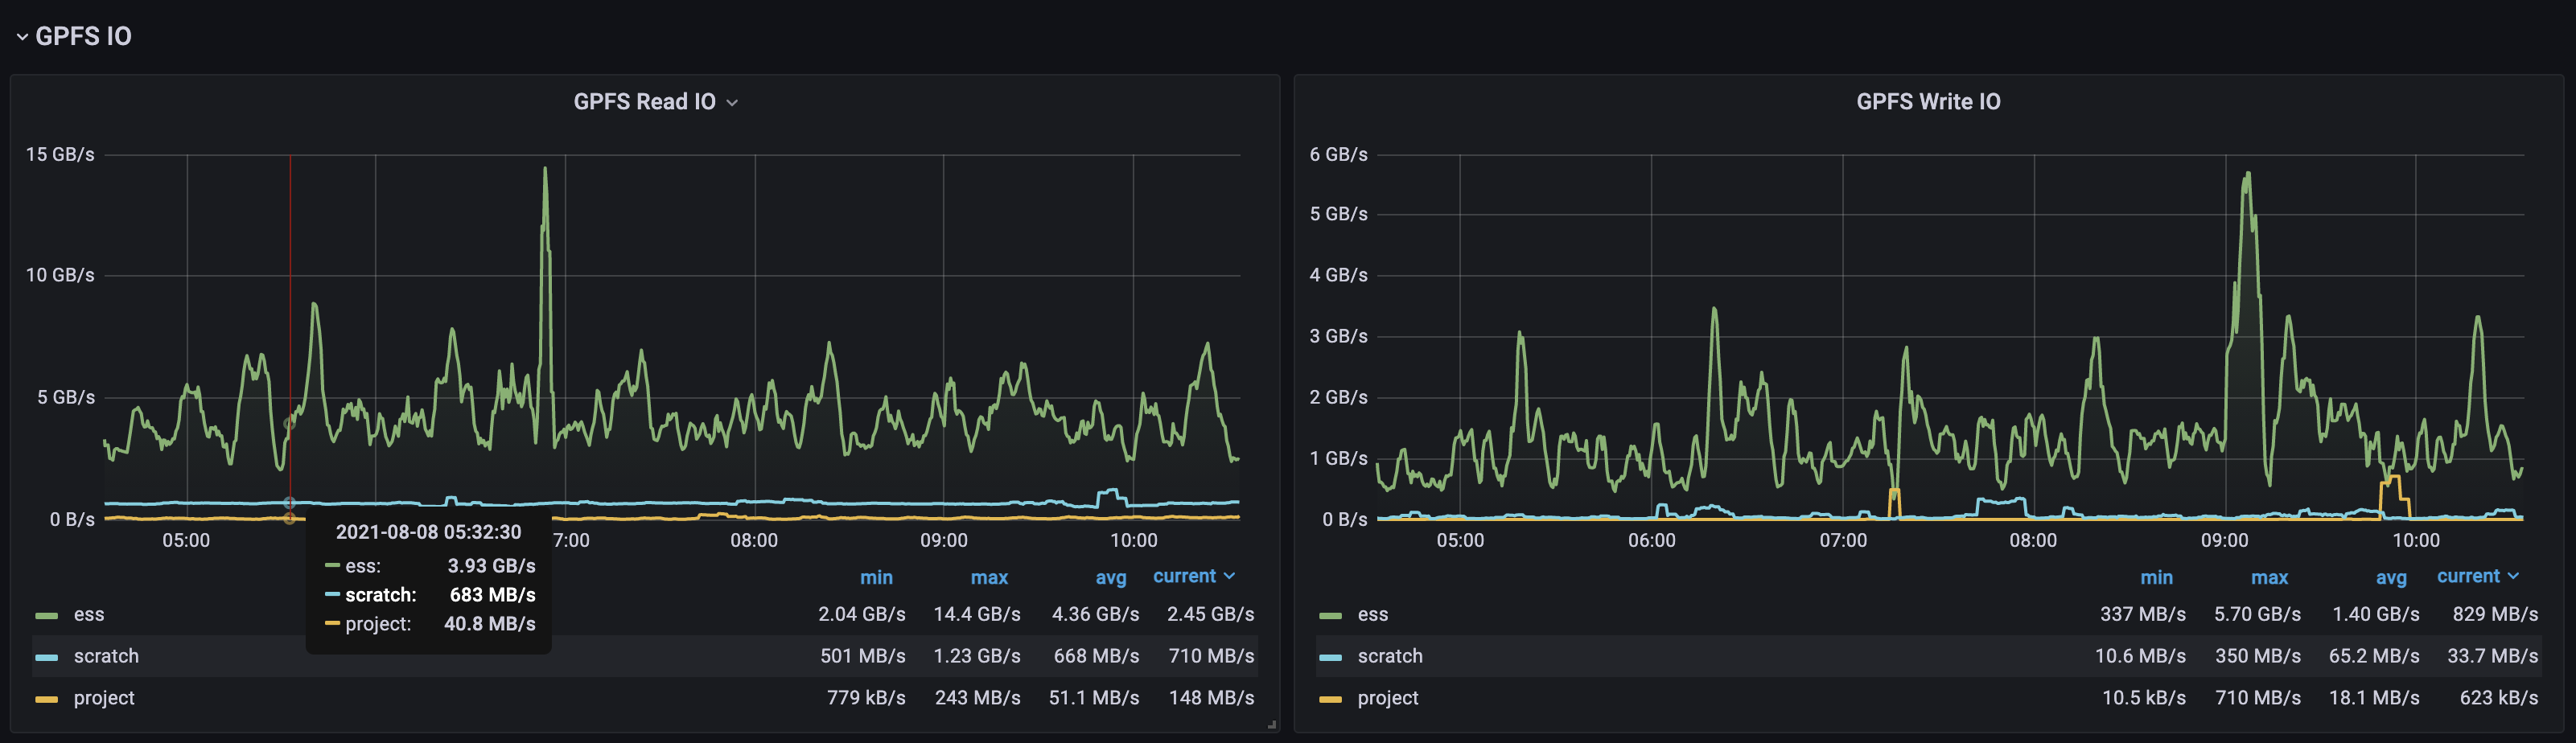
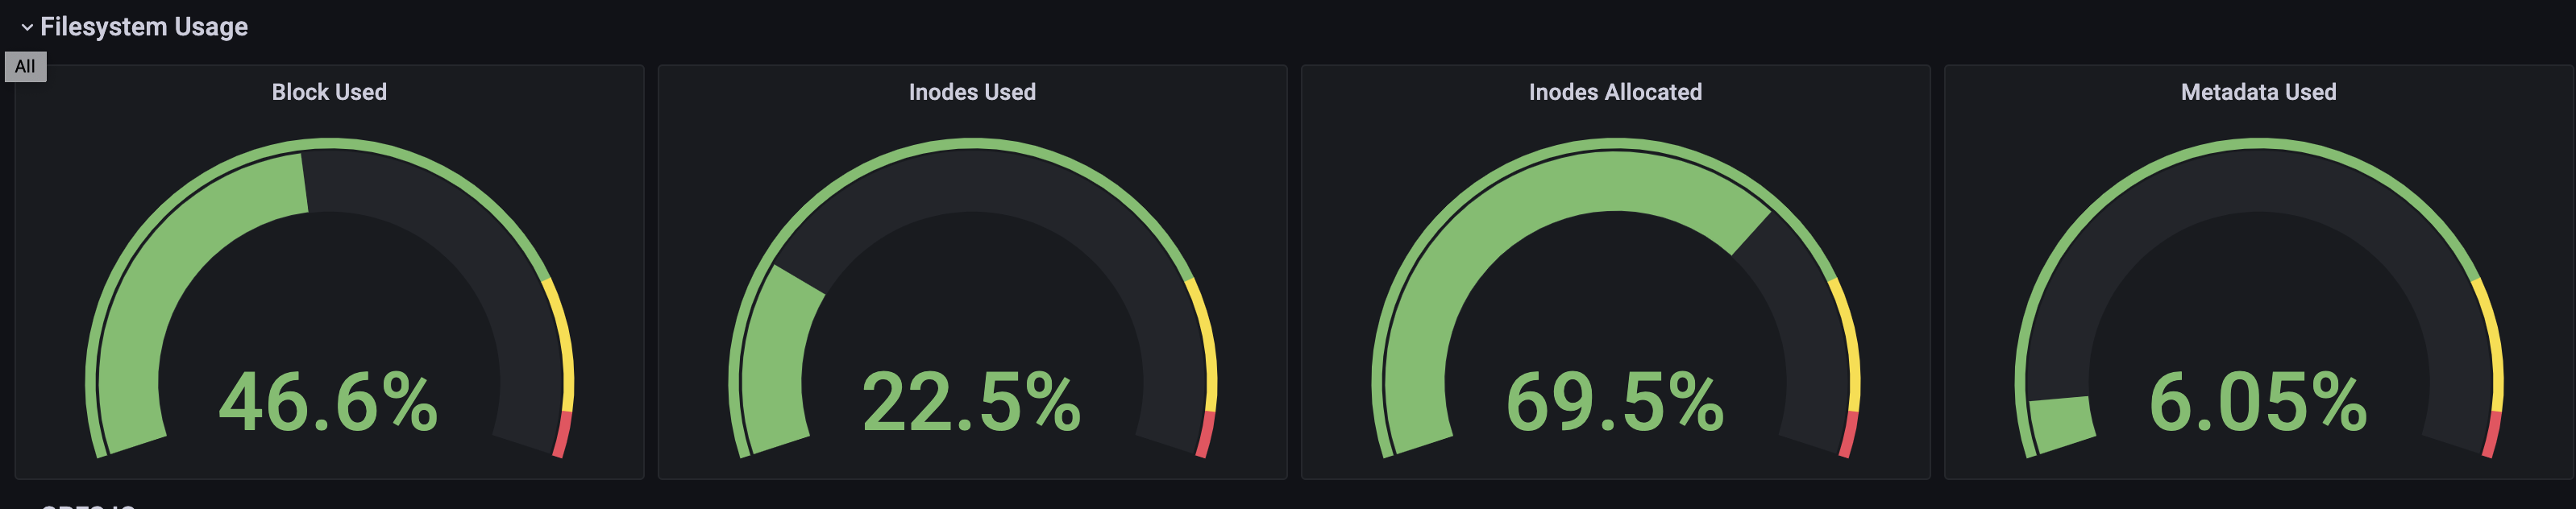
Dashboard for GPFS Exporter performance metrics
This dashboard relies on a few non-standard labels.
The cluster label is expected to be assigned to any clients with the mmpmon collector enabled to get performance metrics. This would be the compute cluster name.
The host label is the short hostname of each node and can be generated in Prometheus using something like the following on the scrape config:
  relabel_configs:
  - source_labels: [__address__]
    regex: "([^.]+)..*"
    replacement: "$1"
target_label: hostData source config
Collector type:
Collector plugins:
Collector config:
Dashboard revisions
Upload an updated version of an exported dashboard.json file from Grafana
| Revision | Decscription | Created | |
|---|---|---|---|
| Download |
Sign up for Grafana Cloud

Get up and running in minutes with the Grafana Cloud free tier, which includes free forever 10k metrics, 50GB logs, 50GB traces, 500 VUh, and more.
Get this dashboard
Data source:
Dependencies: