New K6 Load Testing Results
Based on https://grafana.com/dashboards/4411 A dashboard for visualizing results from the k6.io load testing tool, using the InfluxDB exporter. "Bucket" variable added to select from listed db of InfluxDB
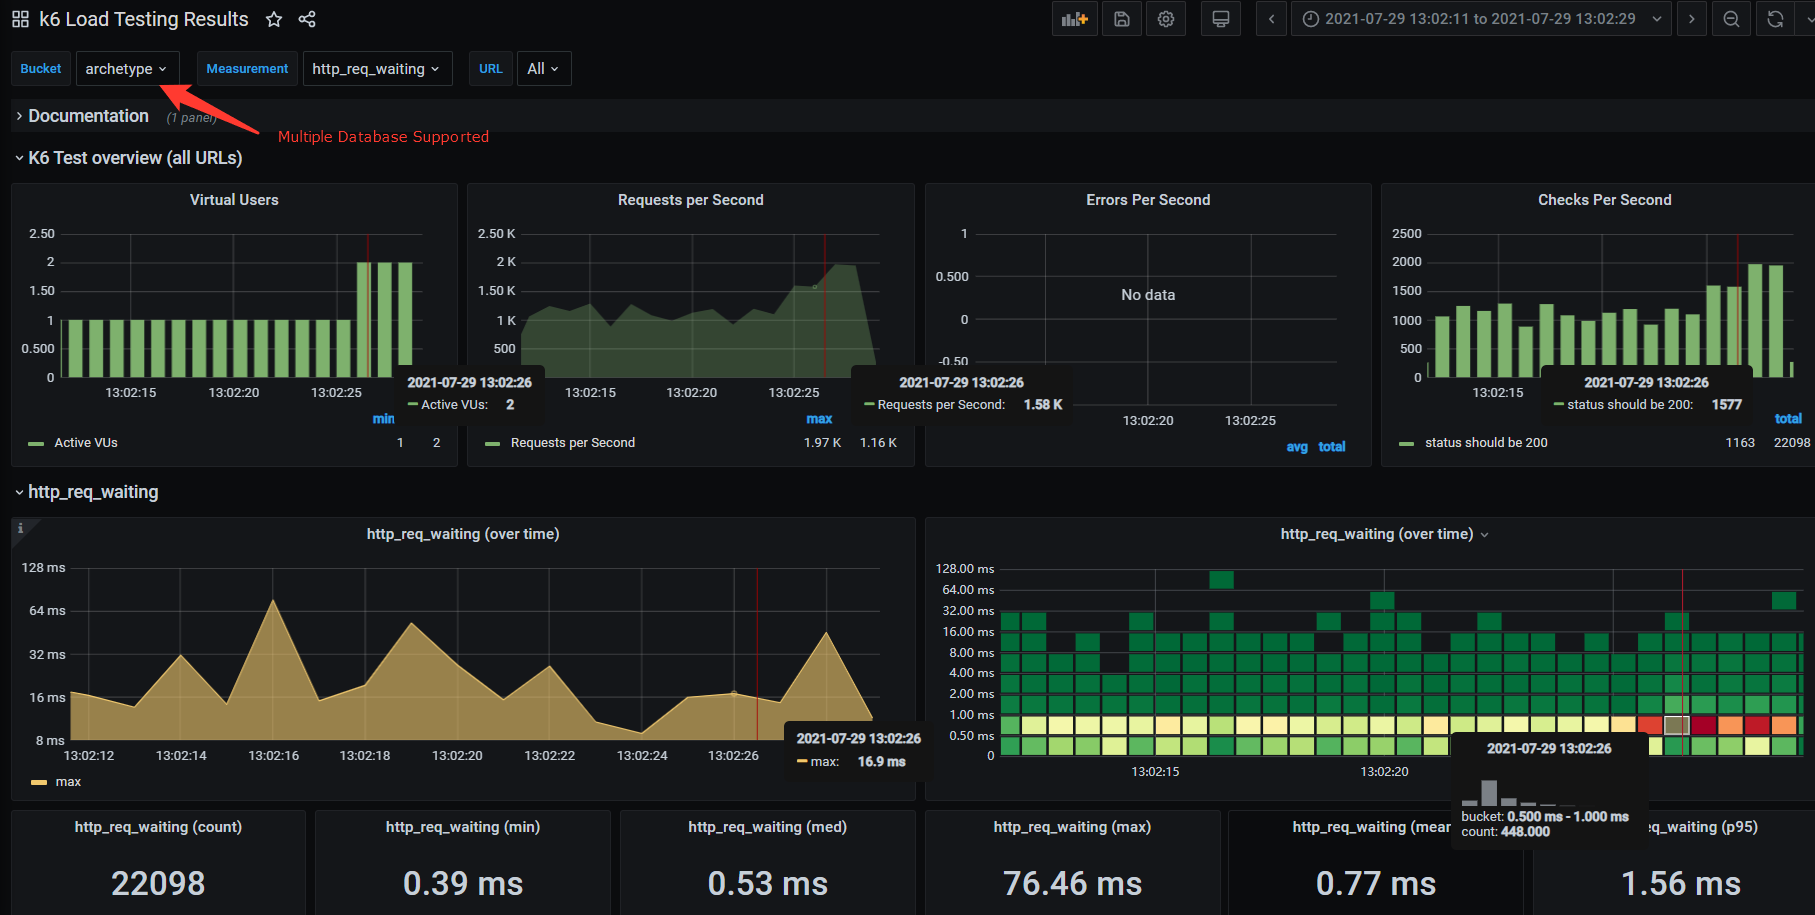
The New K6 Load Testing Results dashboard uses the influxdb data source to create a Grafana dashboard with the graph, heatmap, stat, table-old and text panels.
Data source config
Collector type:
Collector plugins:
Collector config:
Revisions
Upload an updated version of an exported dashboard.json file from Grafana
| Revision | Description | Created | |
|---|---|---|---|
| Download |
New Relic
With the Grafana plugin for New Relic, you can quickly visualize your New Relic data in Grafana.
Learn more