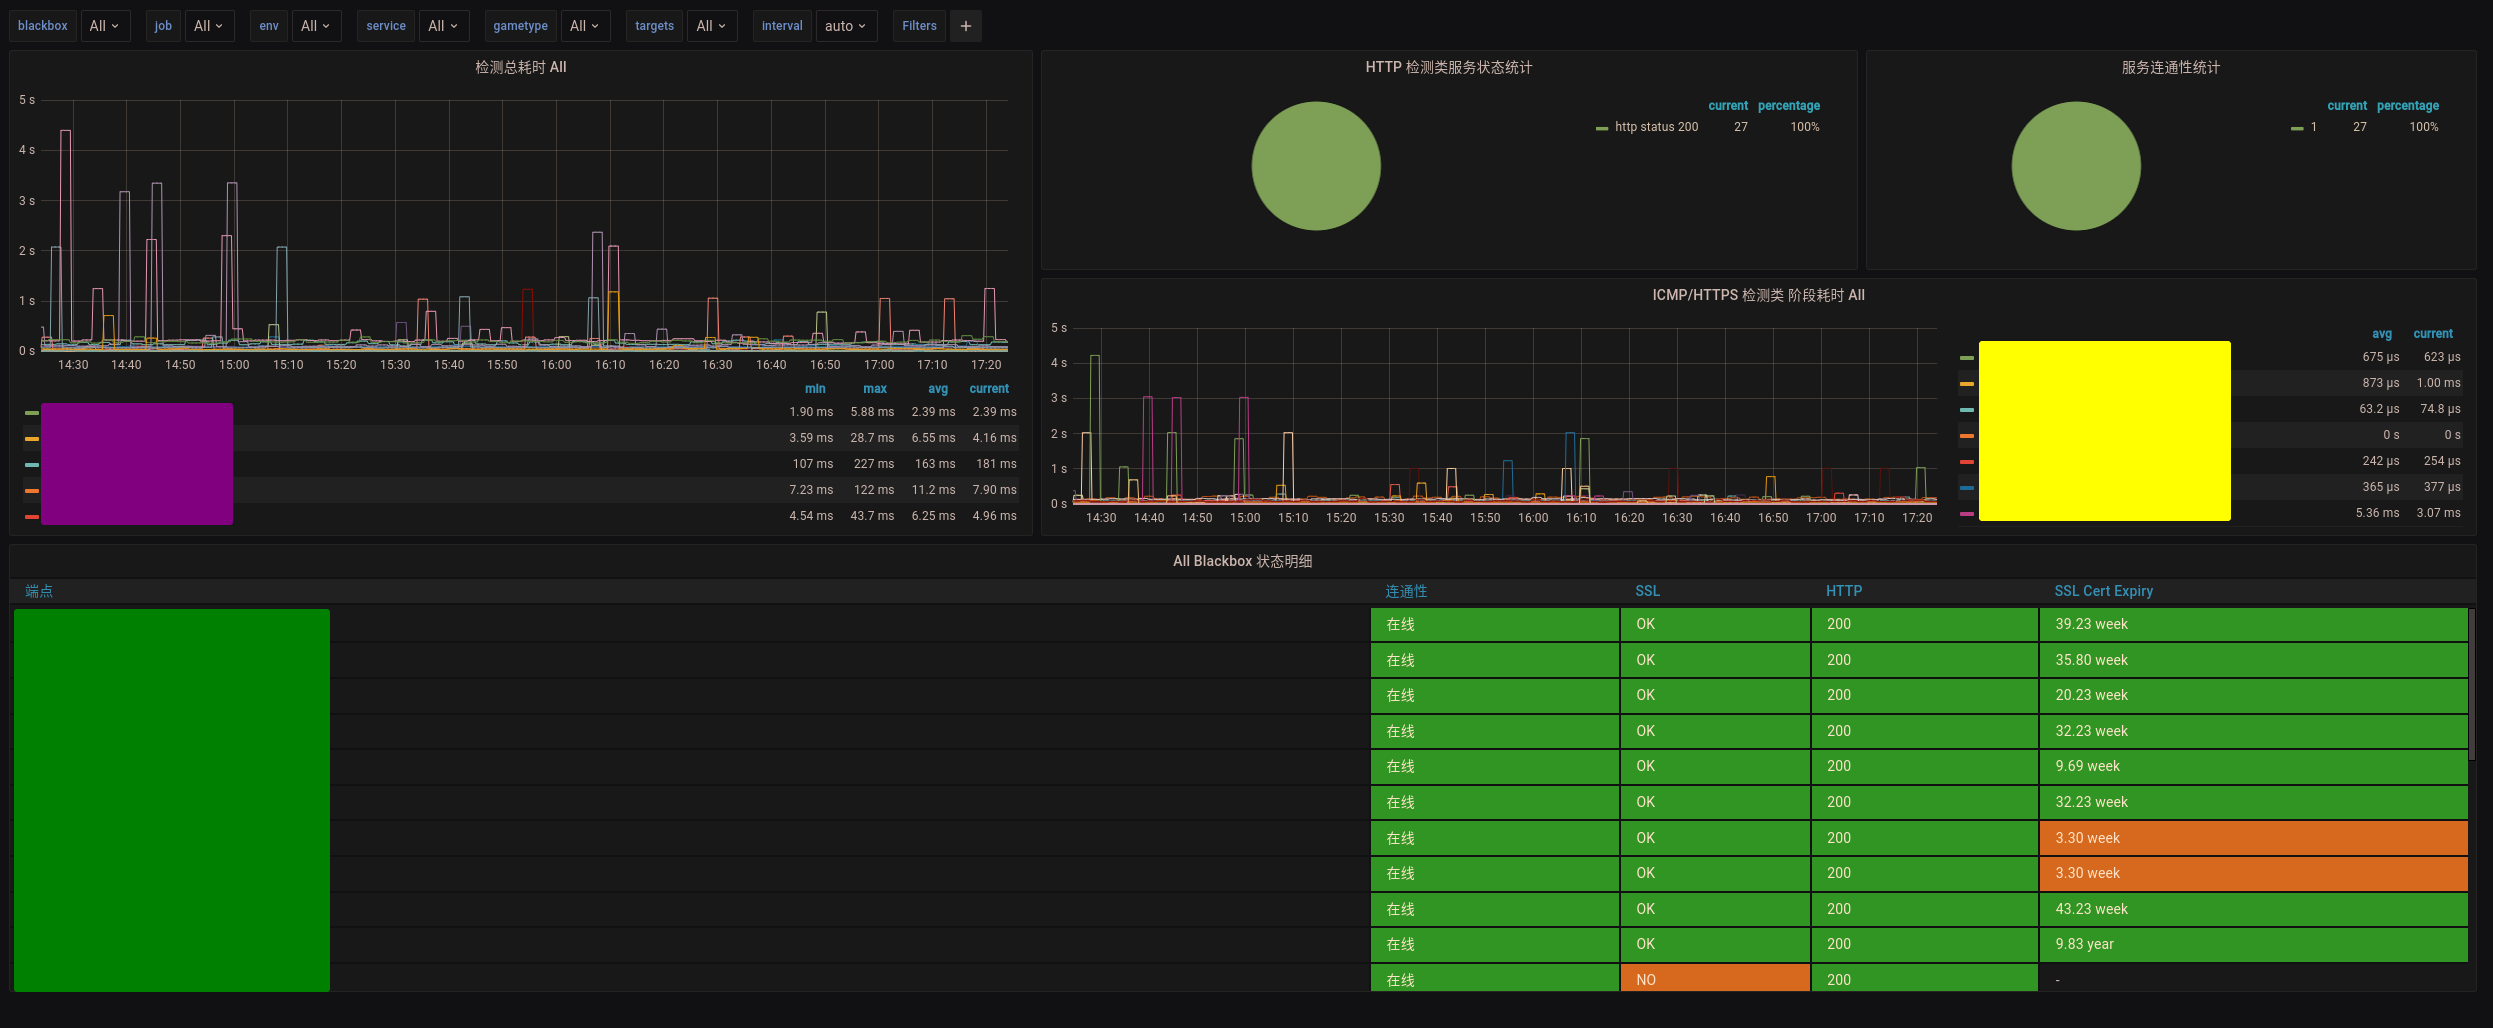
Blackbox Exporter for Prometheus 监控展示看板
在同一看板下展示TCP,ICMP,HTTPS的状态监控,优化各图表展示效果,支持多服务同时展示。
emmm...
Data source config
Collector type:
Collector plugins:
Collector config:
Revisions
Upload an updated version of an exported dashboard.json file from Grafana
| Revision | Description | Created | |
|---|---|---|---|
| Download |
Metrics Endpoint (Prometheus)
Easily monitor any Prometheus-compatible and publicly accessible metrics URL with Grafana Cloud's out-of-the-box monitoring solution.
Learn more