Port Statistics
This dashboard drills down to port level, to display typical operational statistics.
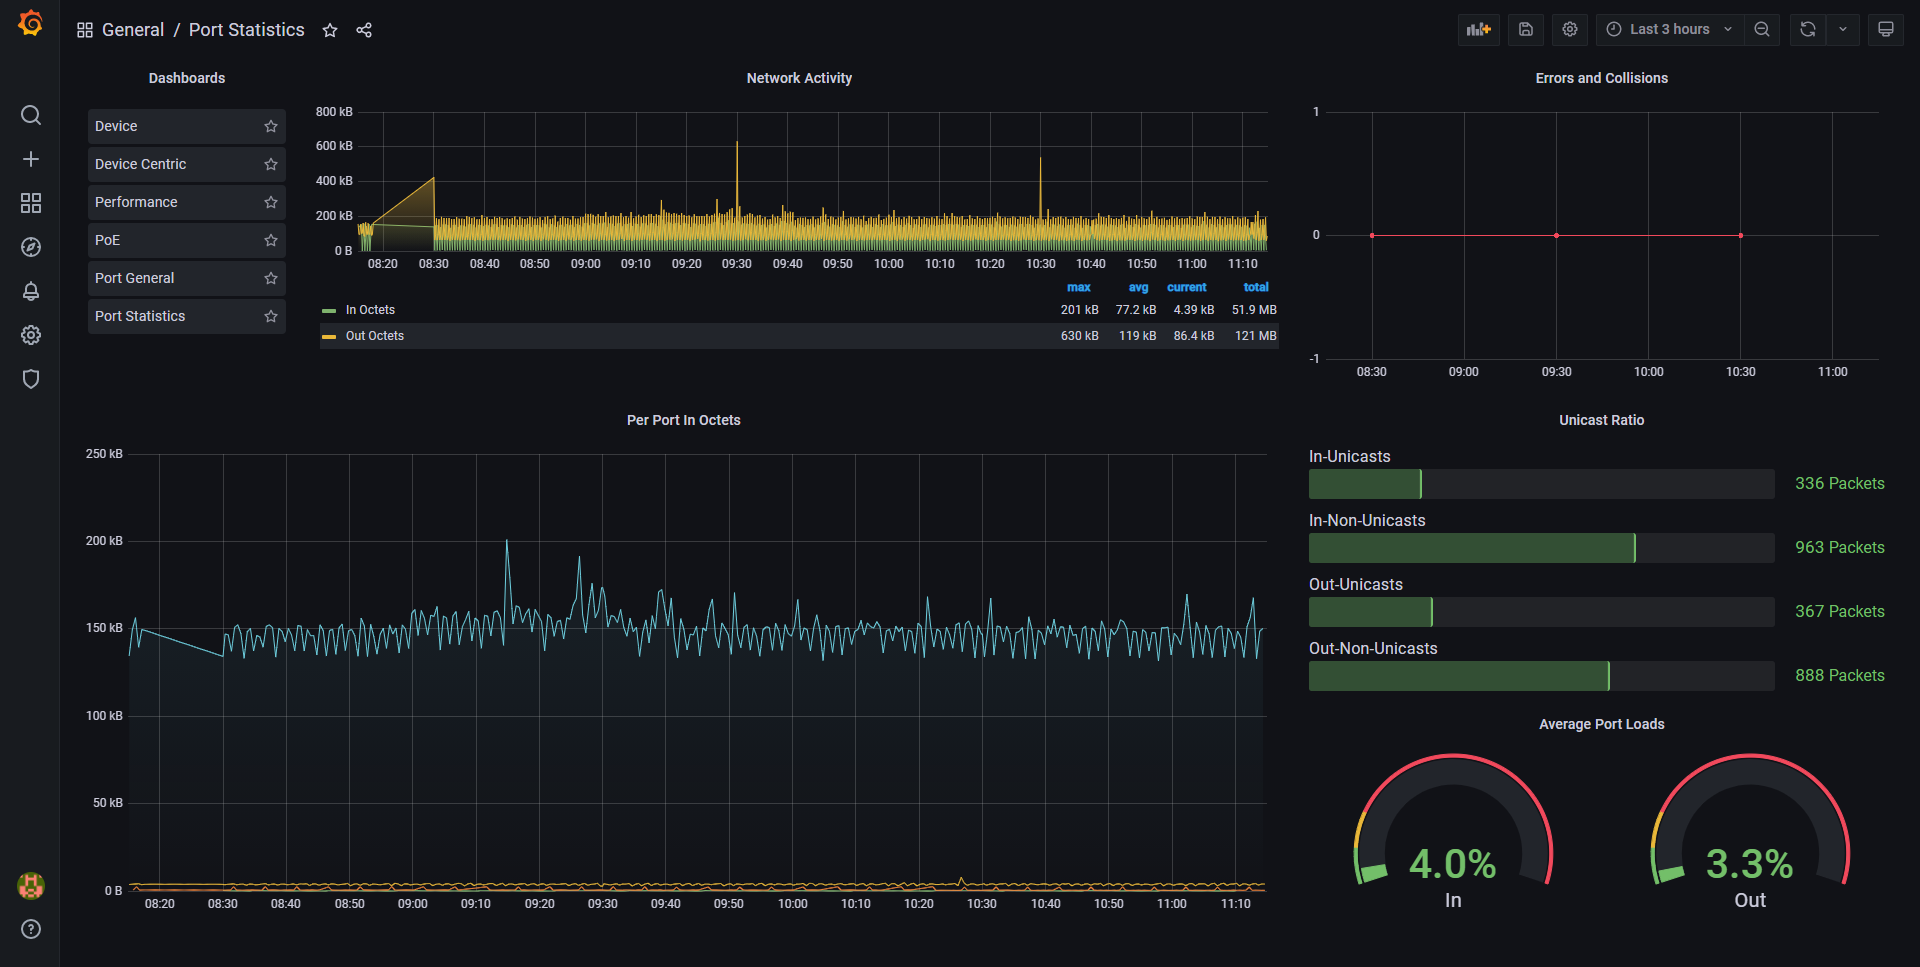
Sometimes performance data is necessary, right down at port level. The Port Statistics Dashboard will provide you with the information you need for the pre-emptive fault finding of network trunks or end device connections, increasing your network availability and reliability.
Data source config
Collector type:
Collector plugins:
Collector config:
Revisions
Upload an updated version of an exported dashboard.json file from Grafana
| Revision | Description | Created | |
|---|---|---|---|
| Download |