
Generic Service
Simplifies monitoring services on Kubernetes. Shows container logs, availability, resource usage and HTTP and gRPC traffic.
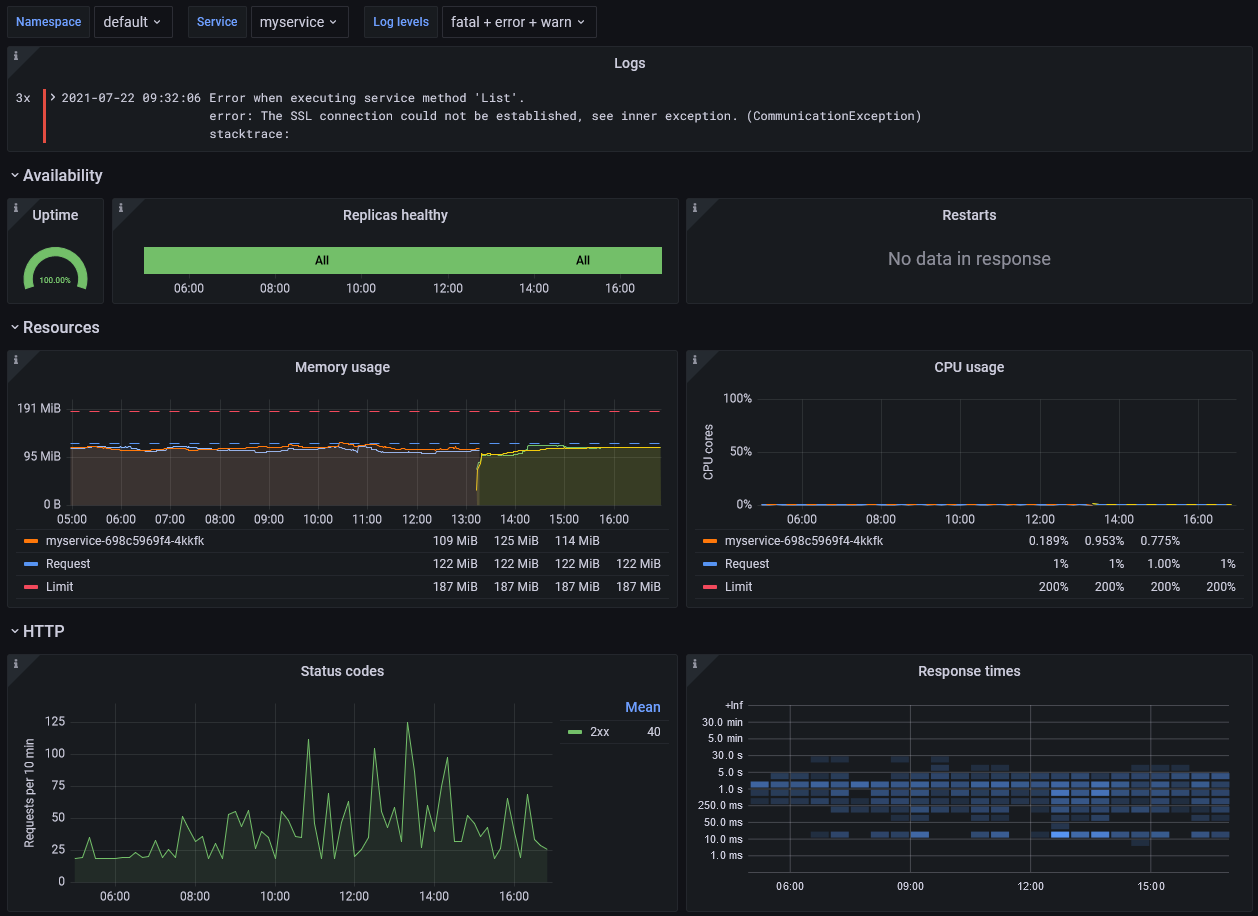
Generic Service Dashboard
This Grafana dashboard simplifies monitoring typical “80% case” services on Kubernetes. It shows:
- Logs
- Availability and Resources
- HTTP and gRPC traffic
Logs
The dashboard assumes you are using Loki to aggregate container log files.
In order for log level filtering to work, you’ll need to ensure log entries carry the label level.
Supported values: trace, debug, info, warn, error, fatal
A typical Promtail configuration to achieve this for JSON-encoded log output could look like this:
pipelineStages:
  - docker: {}
  - cri: {}
  - json:
      expressions:
        ts: ts
        msg: msg
        level: level
  - timestamp:
      source: ts
      format: RFC3339Nano
      action_on_failure: skip
  - labels:
      level:
  - output:
      source: msg
Availability and Resources
The dashboard works well with services deployed using the Generic Service Helm Chart. You can also it with other services, as long as they use Kubernetes Deployments and containers with matching names.
The dashboard shows the average uptime of your service, a timeline when some or all replicas where down and a timeline when pod restarts occurred.
It also shows the containers’ memory and CPU usage, along with requests and limits if they are specified.
Traffic
The dashboard assumes you are using NGINX Ingress Controller or Istio to route HTTP traffic to your containers. In order for traffic to be visualized you need to use Ingresses or VirtualServices with names matching your Deployments.
If you use gRPC and want more detailed information to show up on the dashboard you can provide the necessary metrics by using one of these libraries:
- go-grpc-prometheus for Go
- Nexogen.Libraries.Metrics.Grpc for .NET
Data source config
Collector config:
Dashboard revisions
Upload an updated version of an exported dashboard.json file from Grafana
| Revision | Decscription | Created | |
|---|---|---|---|
| Download |
Get this dashboard
Data source:
Dependencies: