Node - k8s-monitor
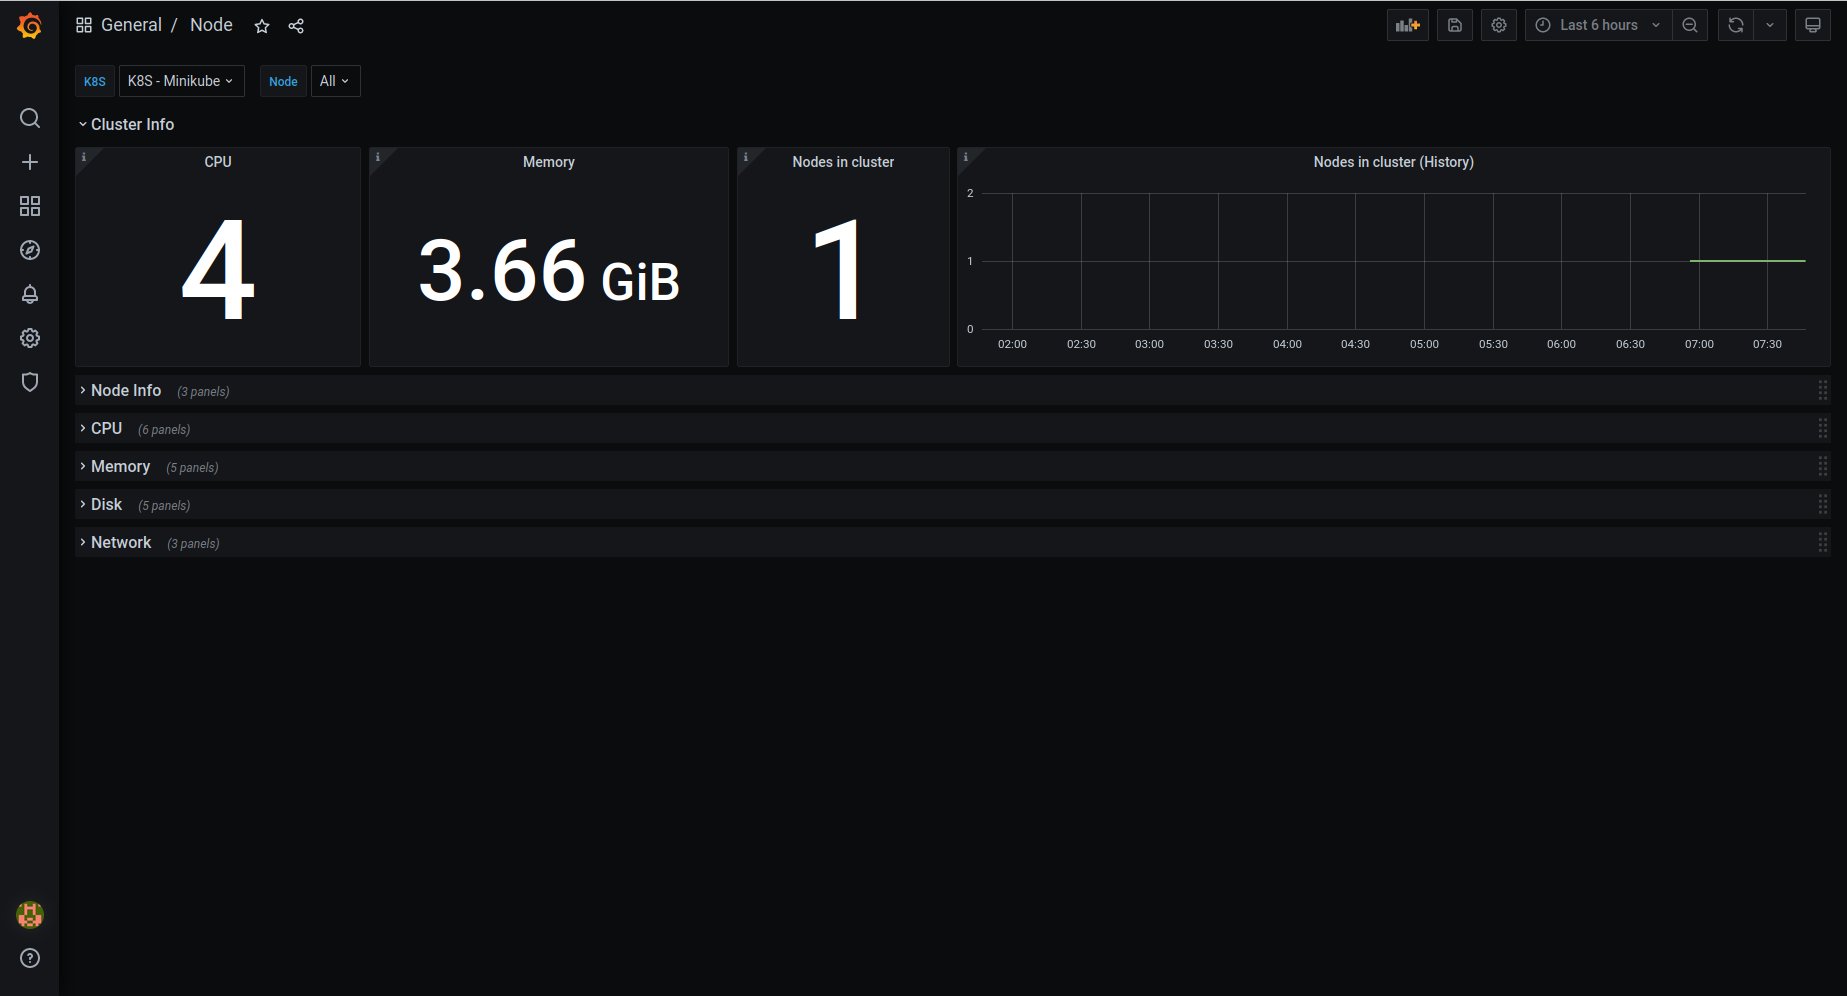
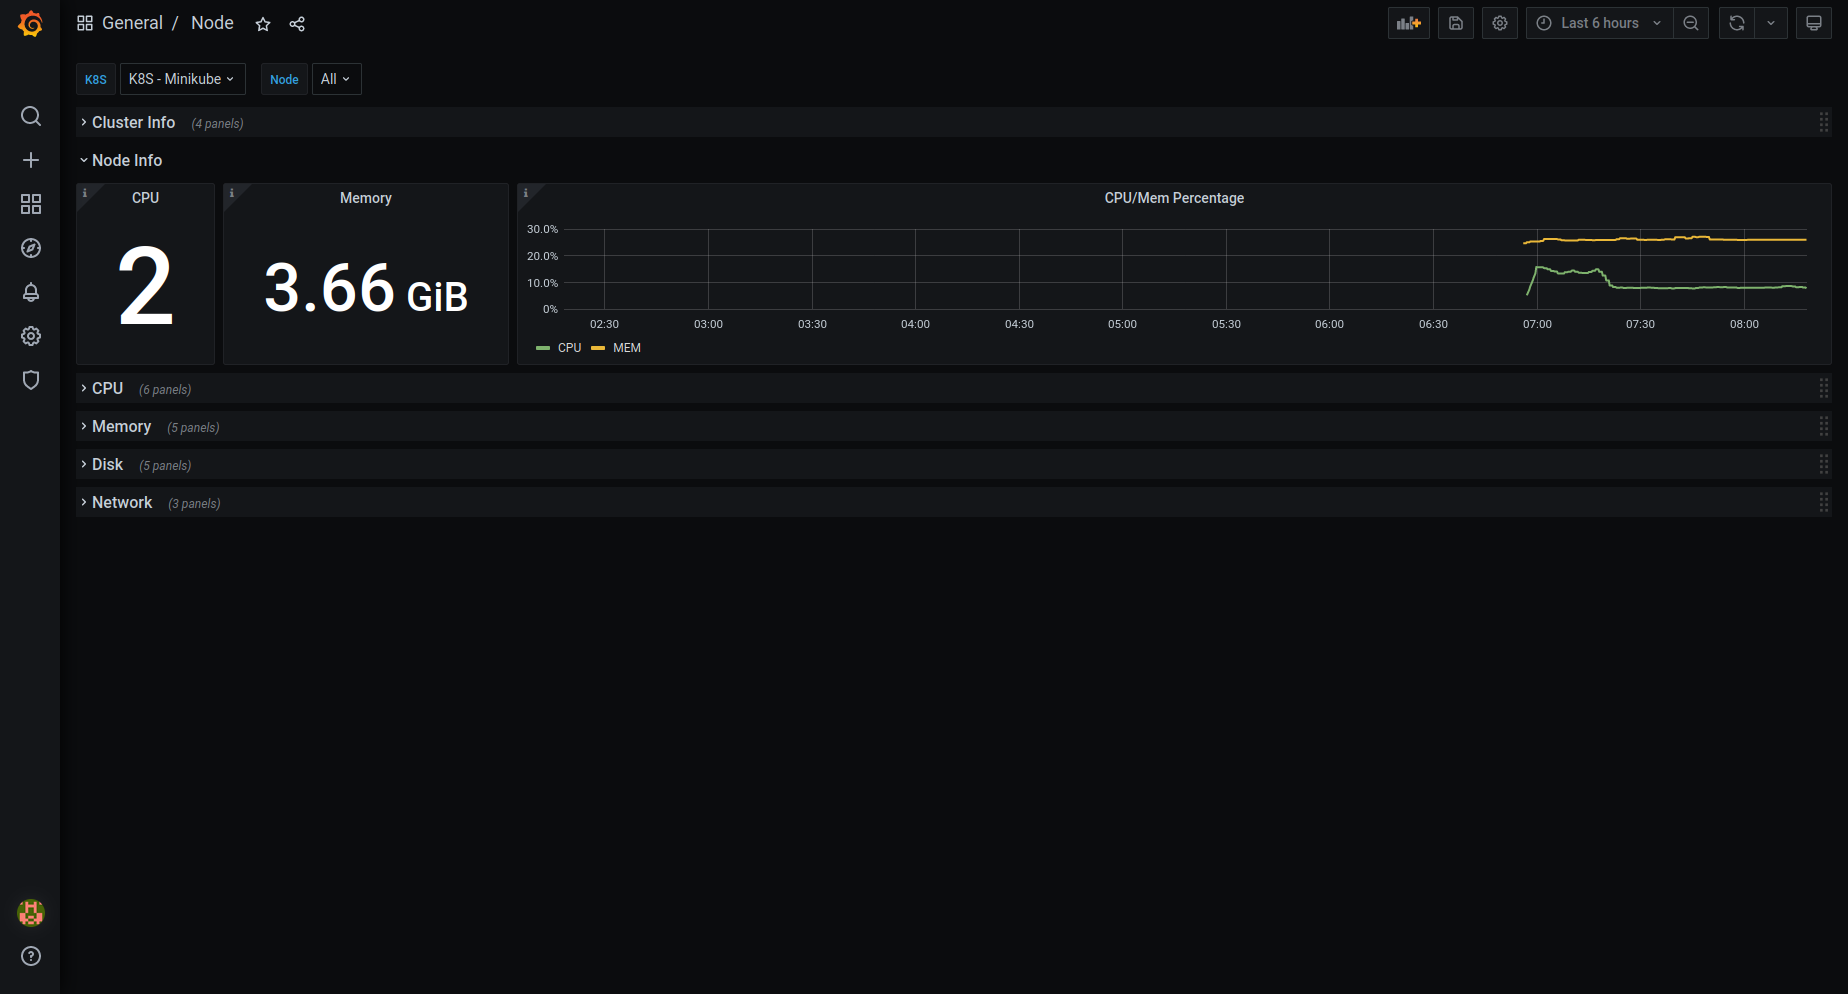
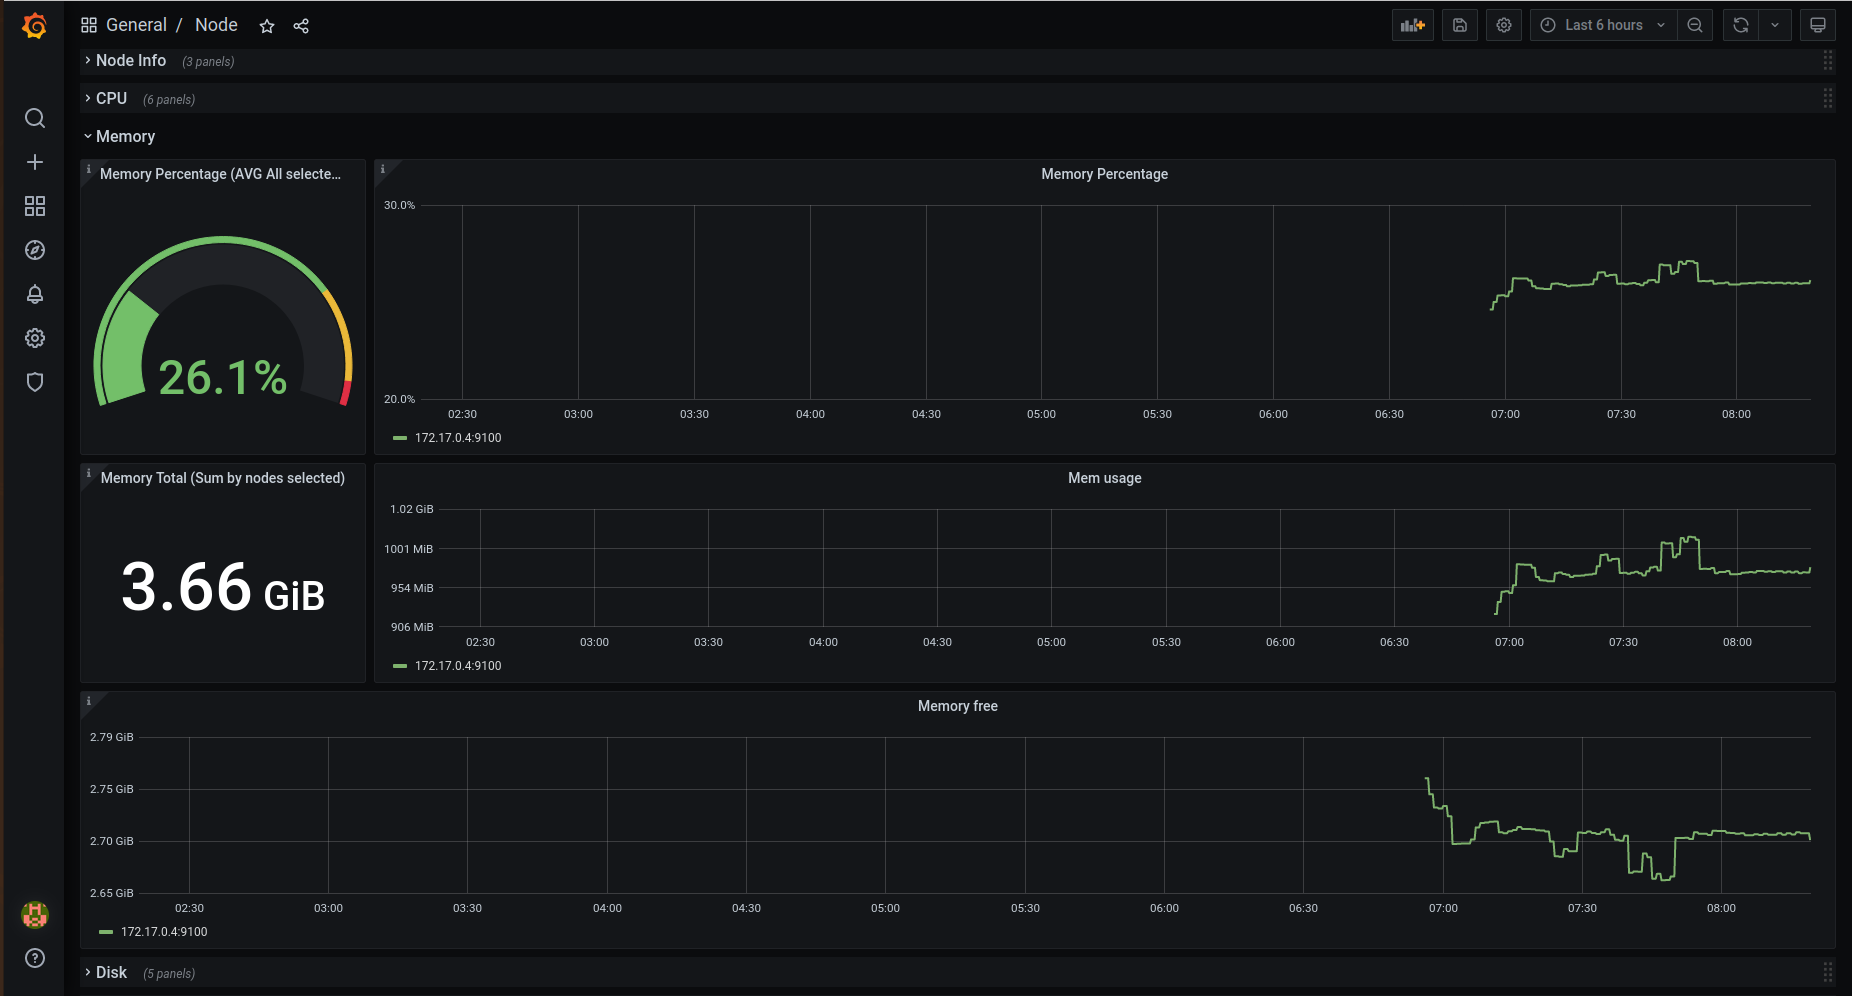
Dashboard develop to work together with k8s-monitor to visualize Node-Exporter metrics.
Node - k8s-monitor
Overview
Node - k8s-monitor was develop to show metrics from Node-Exporter inside k8s-monitor system. This dashboard is ready for accept more than 1 cluster datasource, you just need add multiples datasources with prefix "K8S - ".
How to use
1 - You need install k8s-monitor in your Kubernetes cluster.
2 - Configure a new datasource to prometheus service and setting the name with prefix "K8S - ". If your Grafana is in the same namespace as k8s-monitor, the datasource URL will be http://prometheus-k8s-service:9090.
Please, visit k8s-monitor to get more information and setup guide.
Data source config
Collector config:
Upload an updated version of an exported dashboard.json file from Grafana
| Revision | Description | Created | |
|---|---|---|---|
| Download |
Linux Server
Monitor Linux with Grafana. Easily monitor your Linux deployment with Grafana Cloud's out-of-the-box monitoring solution.
Learn more


