
Sense Collector - Collector Info
Sense Collector provides a way of collecting real-time data from the Sense Energy Monitor. These Grafana dashboards offer visualizations for detected devices and smart plugs and their wattage, voltage, and amp utilization.
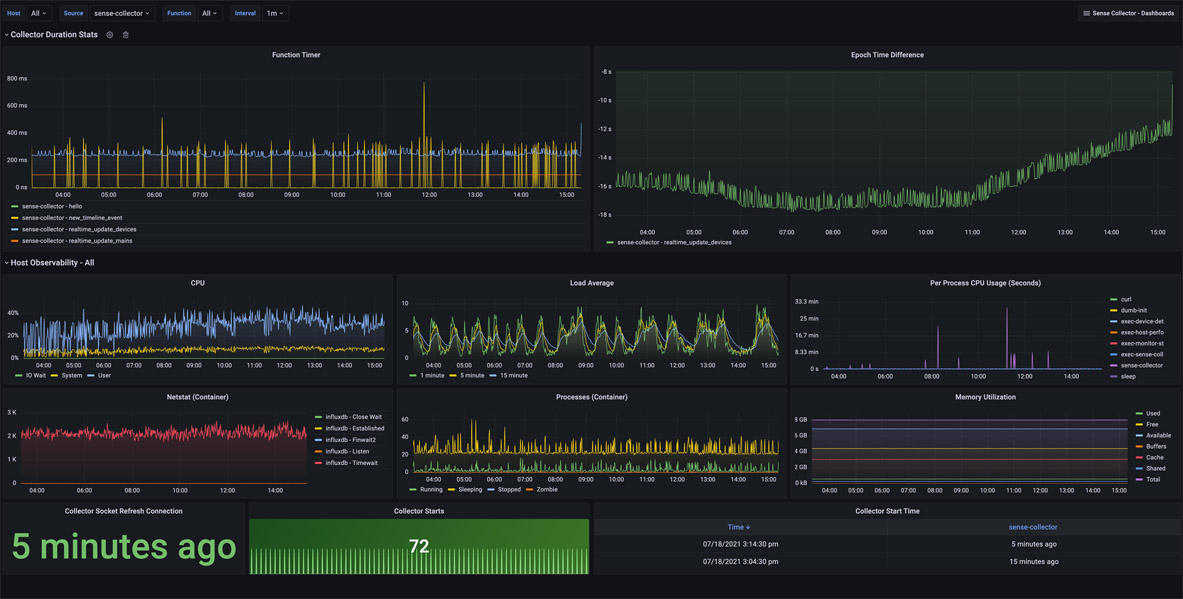
Collector Info: Provides observability into how the Sense Collector functions alongside metrics related to the host’s performance. This dashboard helps understand the performance of the main collector functions to assist with troubleshooting.
Epoch Time Difference: Helps determine if your hosts can keep up with processing messages from the Sense monitor. It provides the difference between the host time and the epoch time received in the Sense monitor data. Negative numbers mean the Sense monitor is ahead of the hosts. Positive numbers mean the host is behind the Sense monitor. If the drift trends to the positive, it may also mean that there’s just time clock drift. Ensure you keep an eye on the NTP time sync on both your host and Sense if there’s a large discrepancy.
CPU, Load Average, Memory Utilization: These panels show host-level details and are not specific to the performance of the docker container. Per Process CPU Usage, Netstat, and Processes are particular to the container.
Collector Starts: Provide the last time the container and process were started. The connection is reset every ten minutes due to the way Sense times out the connection.
More details on these Sense Collector dashboards may be found:
Github Project: https://github.com/lux4rd0/sense-collector/
Data source config
Collector config:
Dashboard revisions
Upload an updated version of an exported dashboard.json file from Grafana
| Revision | Decscription | Created | |
|---|---|---|---|
| Download |
Get this dashboard
Data source:
Dependencies: