
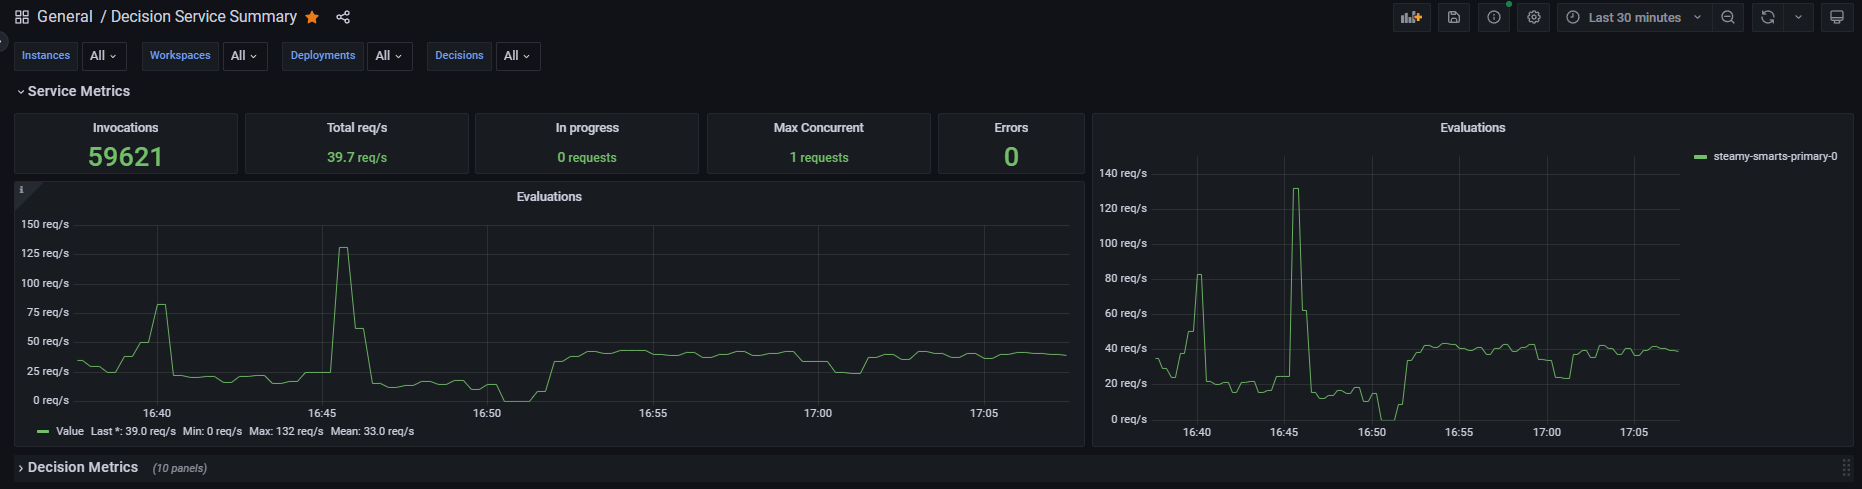
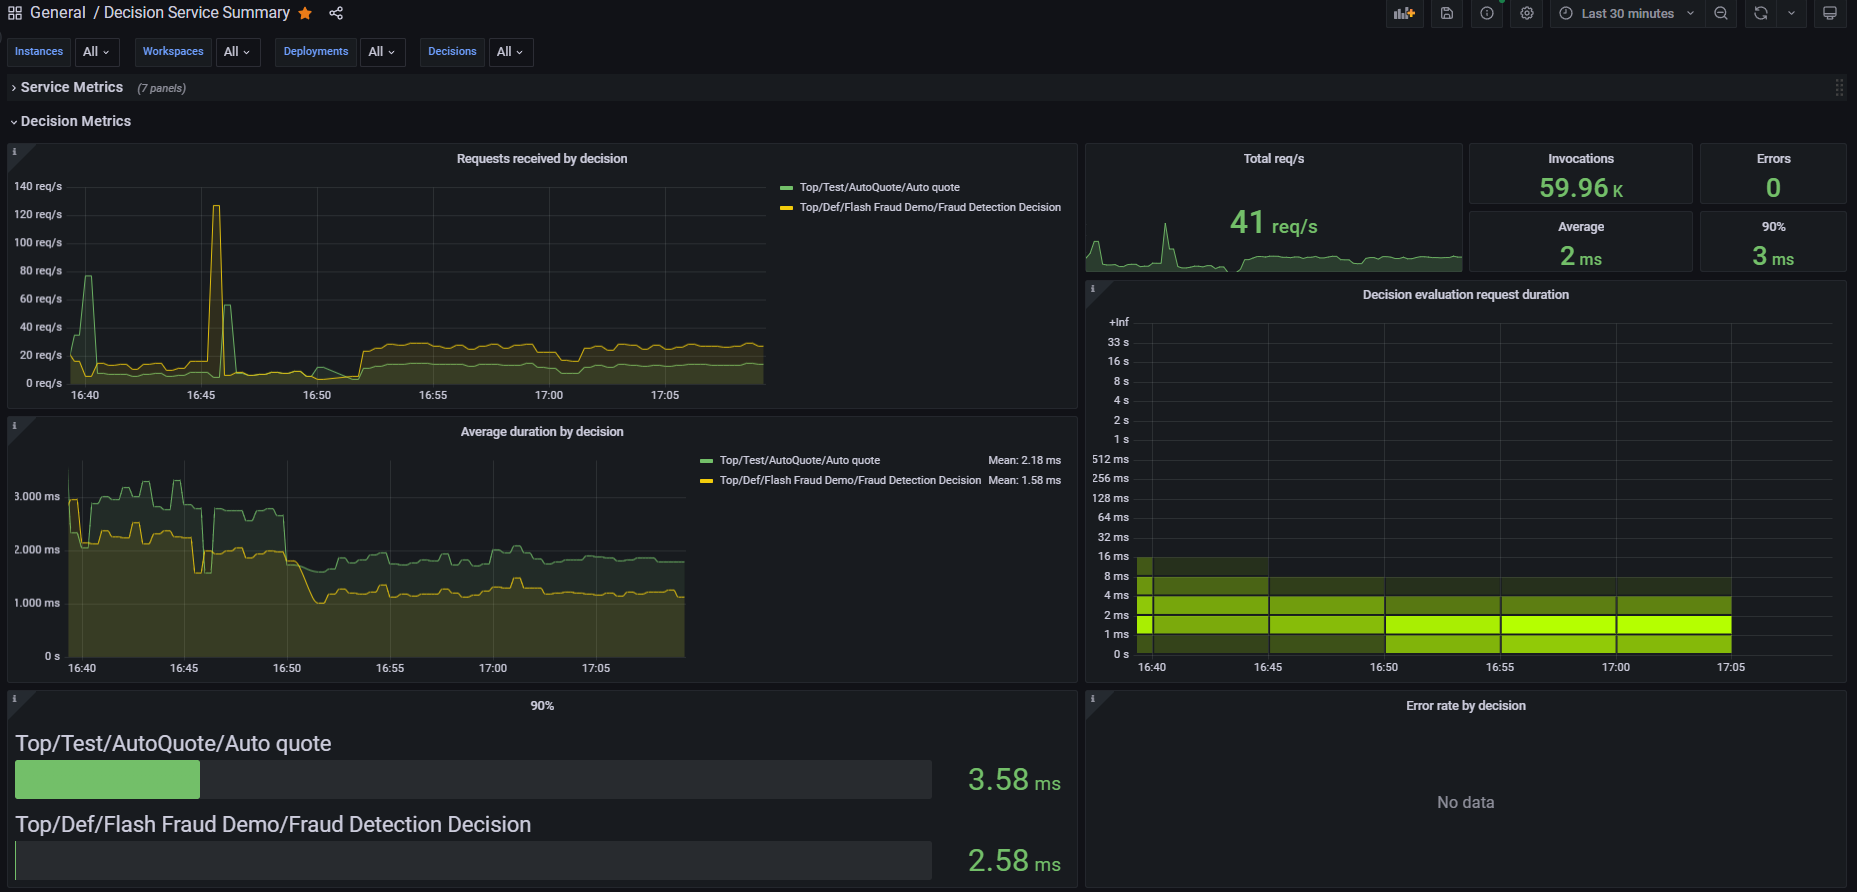
Decision Service Summary
Basic measurements of decision evaluations using data from Sparkling Logic SMARTS(tm)
Decision Evaluation Metrics
This dashboard is for use with Sparkling Logic SMARTS(tm) Decision Services and can show you the following information for decision evaluations
- Request per second
- Average duration per request
- Number of requests in progress
- Request duration histogram and 90% quantile
SMARTS Configuration
If you deployed SMARTS using a helm chart, then you can easily enable your deployment for metrics scraping as follows:
metrics:
  enabled: true
  serviceMonitor:
    enabled: true
Prometheus Configuration
If you are using a Prometheus Server then you may need to configure this server to remote write your metrics to Grafana.
For example:
prometheus:
  prometheusSpec:
    remoteWrite:
    - url: "https://prometheus-blocks-prod-us-central1.grafana.net/api/prom/push"
      basicAuth:
          username:
            name: grafanasecret
            key: username
          password:
            name: grafanasecret
key: passwordData source config
Collector type:
Collector plugins:
Collector config:
Dashboard revisions
Upload an updated version of an exported dashboard.json file from Grafana
| Revision | Decscription | Created | |
|---|---|---|---|
| Download |
Sign up for Grafana Cloud

Get up and running in minutes with the Grafana Cloud free tier, which includes free forever 10k metrics, 50GB logs, 50GB traces, 500 VUh, and more.
Get this dashboard
Data source:
Dependencies: