Meter Passport Relayer
A dashboard for Meter blockchain node and Meter Passport Relayer key metrics monitoring. Includes relayer's logs as well as ETH, MTR and BNB balances monitoring. Uses InfluxDB as a data source.
Do not forget to replace {{ template_variables }} in all given examples of Telegraf configuration files
Dashboard description
The dasboard has 3 sections
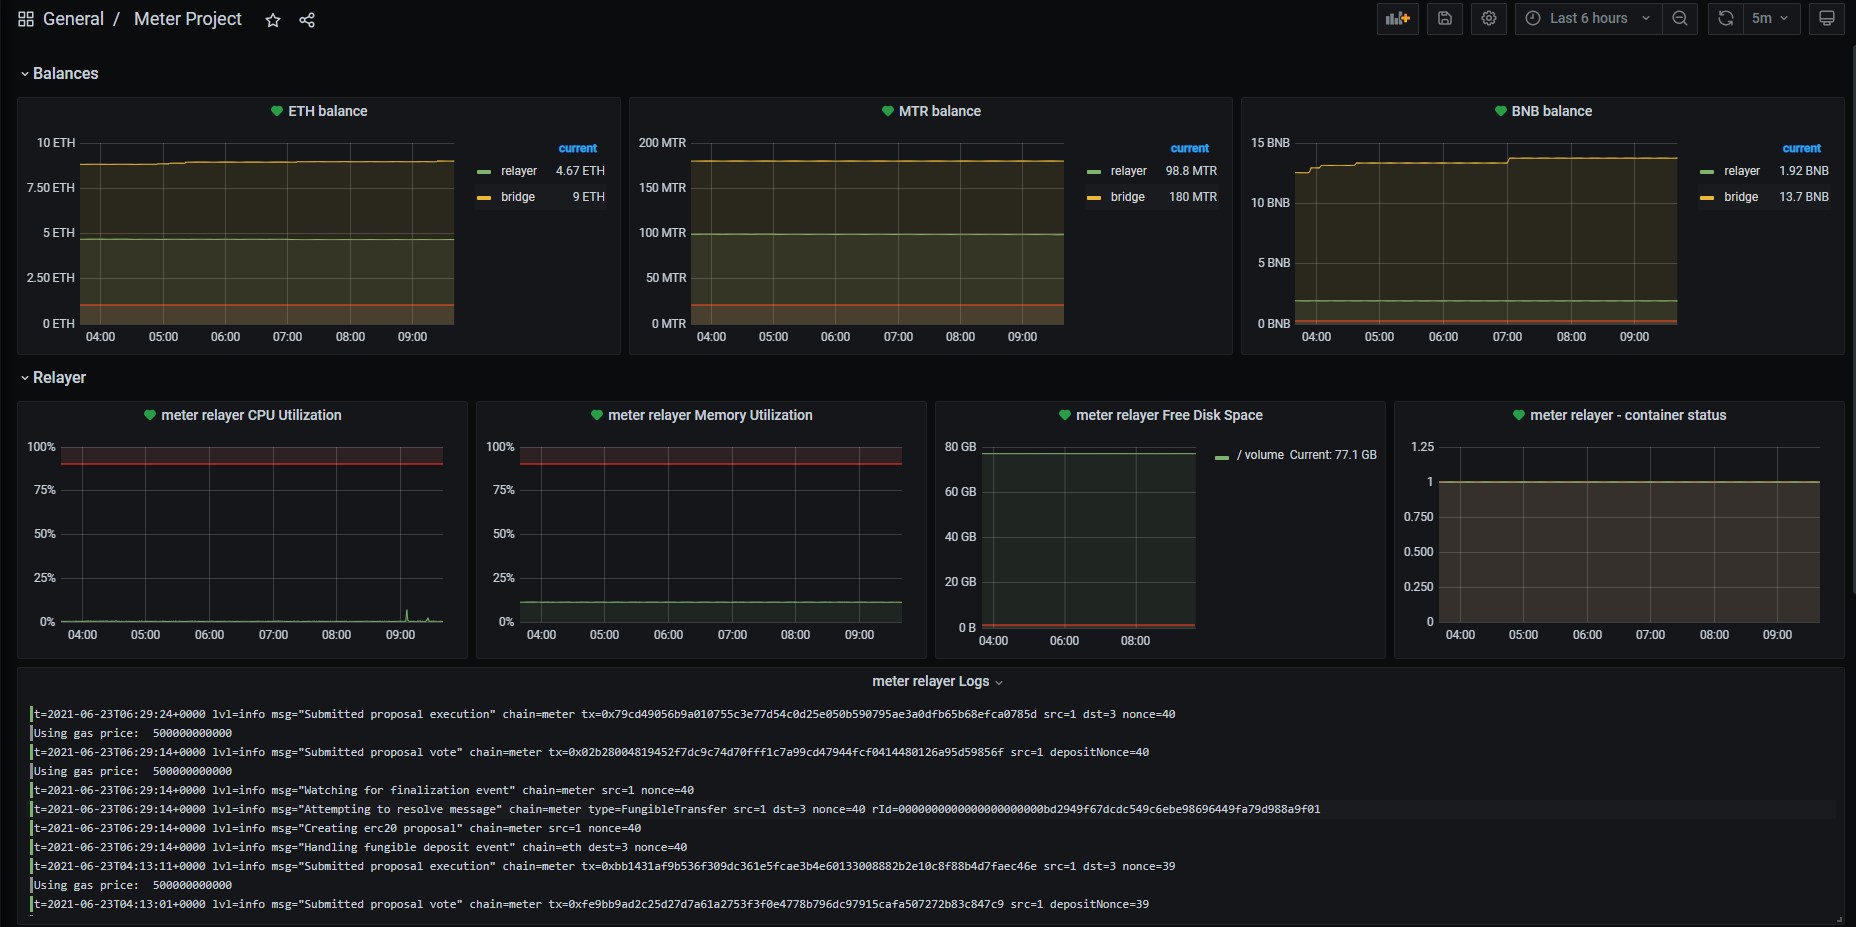
The first one shows balances for relayer's address in ETH, MTR and BNB as well as bridge balances in all these blockchains
The second section shows relayer's host key metrics such as CPU, RAM and disk usage, number of running docker containers and logs from relayer's container
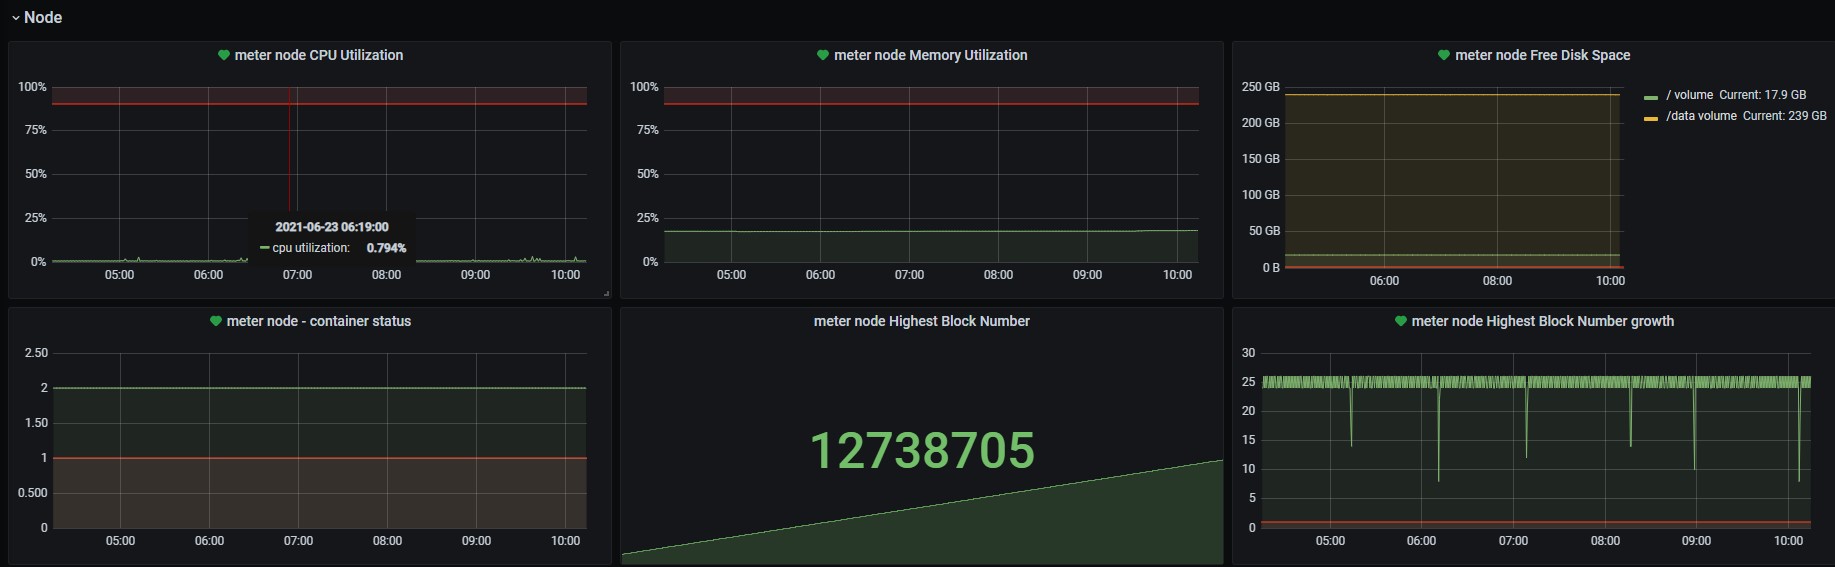
The last section is for Meter node. Use it if you host your own node. It shows node's CPU, RAM and Disk utilization, number of running containers and tracks the tip of the blockachain. You can find there a panel with highest imported block number and a panel with blocks imported per minute information
You can find telegraf.conf example for meter-passport-relayer in the Collector Configuration Details section
Telegraf configuration for meter node uses the same cpu, mem, disk and docker inputs as for relayer with some additions for blockchain metrics. Here is the telegraf.conf for meter-node:
[global_tags]
[agent]
  interval = "30s"
  round_interval = true
  metric_batch_size = 1000
  metric_buffer_limit = 10000
  collection_jitter = "0s"
  flush_interval = "10s"
  flush_jitter = "0s"
  hostname = "meter"
  omit_hostname = false
  logfile = "/var/log/telegraf/telegraf.log"
[[inputs.cpu]]
percpu = false
totalcpu = true
collect_cpu_time = false
fieldpass = ["usage_idle"]
[[inputs.mem]]
fieldpass = ["used_percent"]
[[inputs.disk]]
ignore_fs = ["tmpfs", "devtmpfs", "devfs", "iso9660", "overlay", "aufs", "squashfs"]
fieldpass = ["used_percent","free"]
Node container
[[inputs.docker]]
endpoint = "unix:///var/run/docker.sock"
gather_services = false
container_name_include = ["*"]
timeout = "5s"
perdevice = false
total = false
fieldpass = ["n_containers_running"]
Meter blockchain metrics
Highest block number
[[inputs.http]]
urls = ["http://localhost:8669/blocks/best"]
method = "GET"
headers = {"Content-Type" = "application/json"}
data_format = "json"
json_string_fields = ["number"]
[inputs.http.tags]
api_endpoint = "blocks"
Data source config
Collector config:
Upload an updated version of an exported dashboard.json file from Grafana
| Revision | Description | Created | |
|---|---|---|---|
| Download |