Domain Exporter for Prometheus 监控展示看板
展示域名的过期时间监控,支持多域名同时展示。
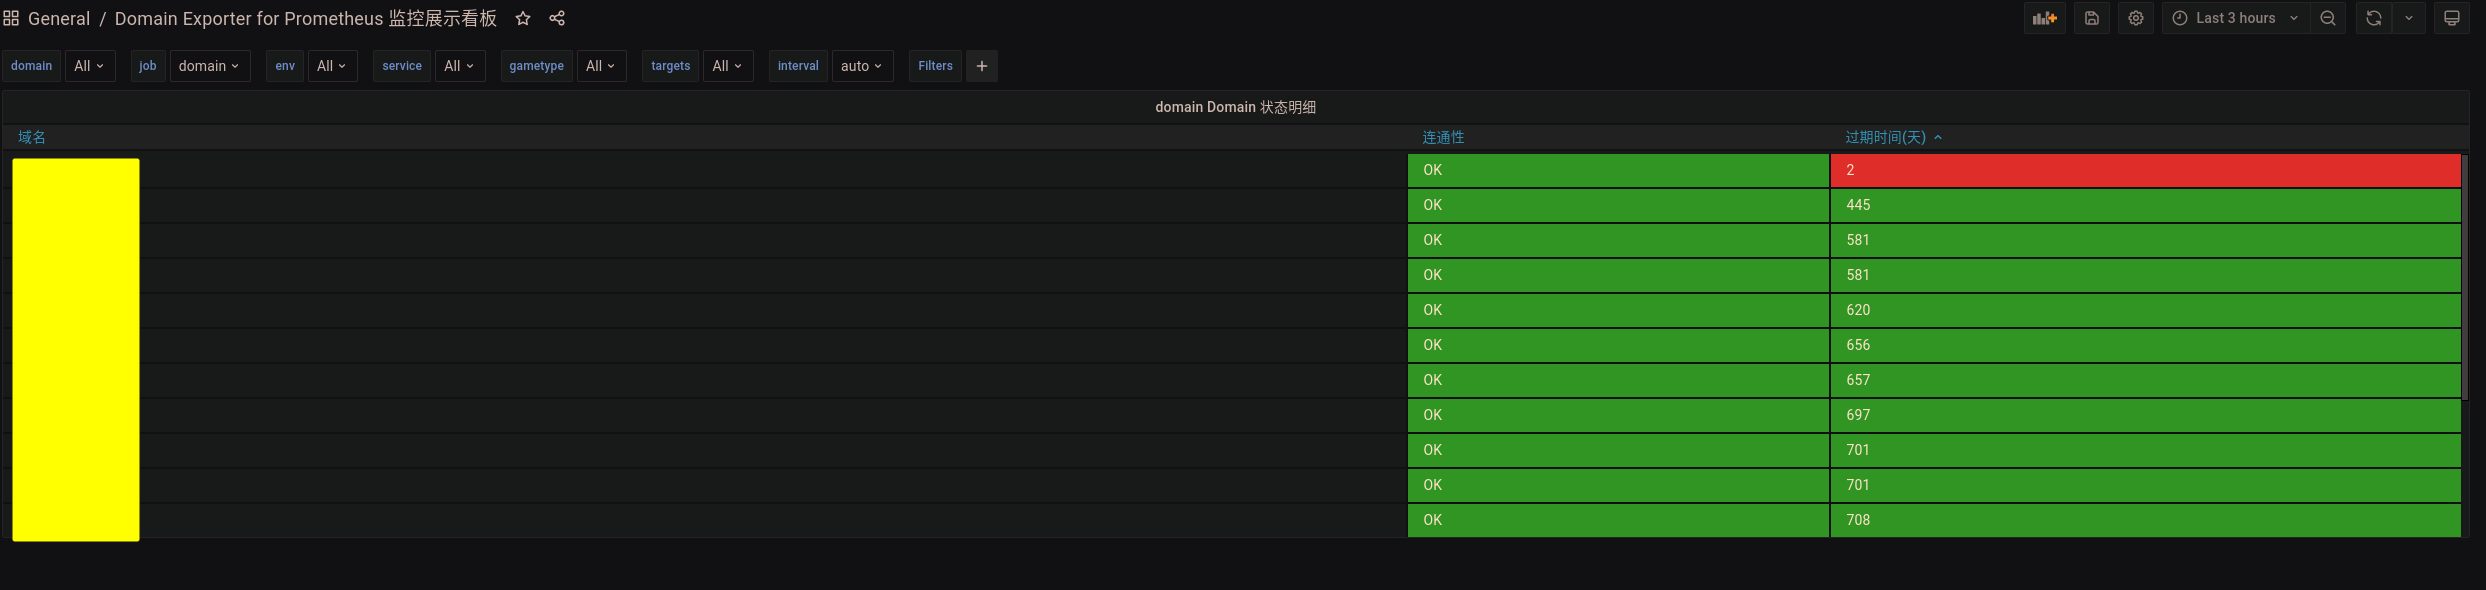
The Domain Exporter for Prometheus 监控展示看板 dashboard uses the prometheus data source to create a Grafana dashboard with the table-old panel.
Data source config
Collector type:
Collector plugins:
Collector config:
Revisions
Upload an updated version of an exported dashboard.json file from Grafana
| Revision | Description | Created | |
|---|---|---|---|
| Download |
Metrics Endpoint (Prometheus)
Easily monitor any Prometheus-compatible and publicly accessible metrics URL with Grafana Cloud's out-of-the-box monitoring solution.
Learn more