
Jira
Shows Jira server and usage metrics
Overview
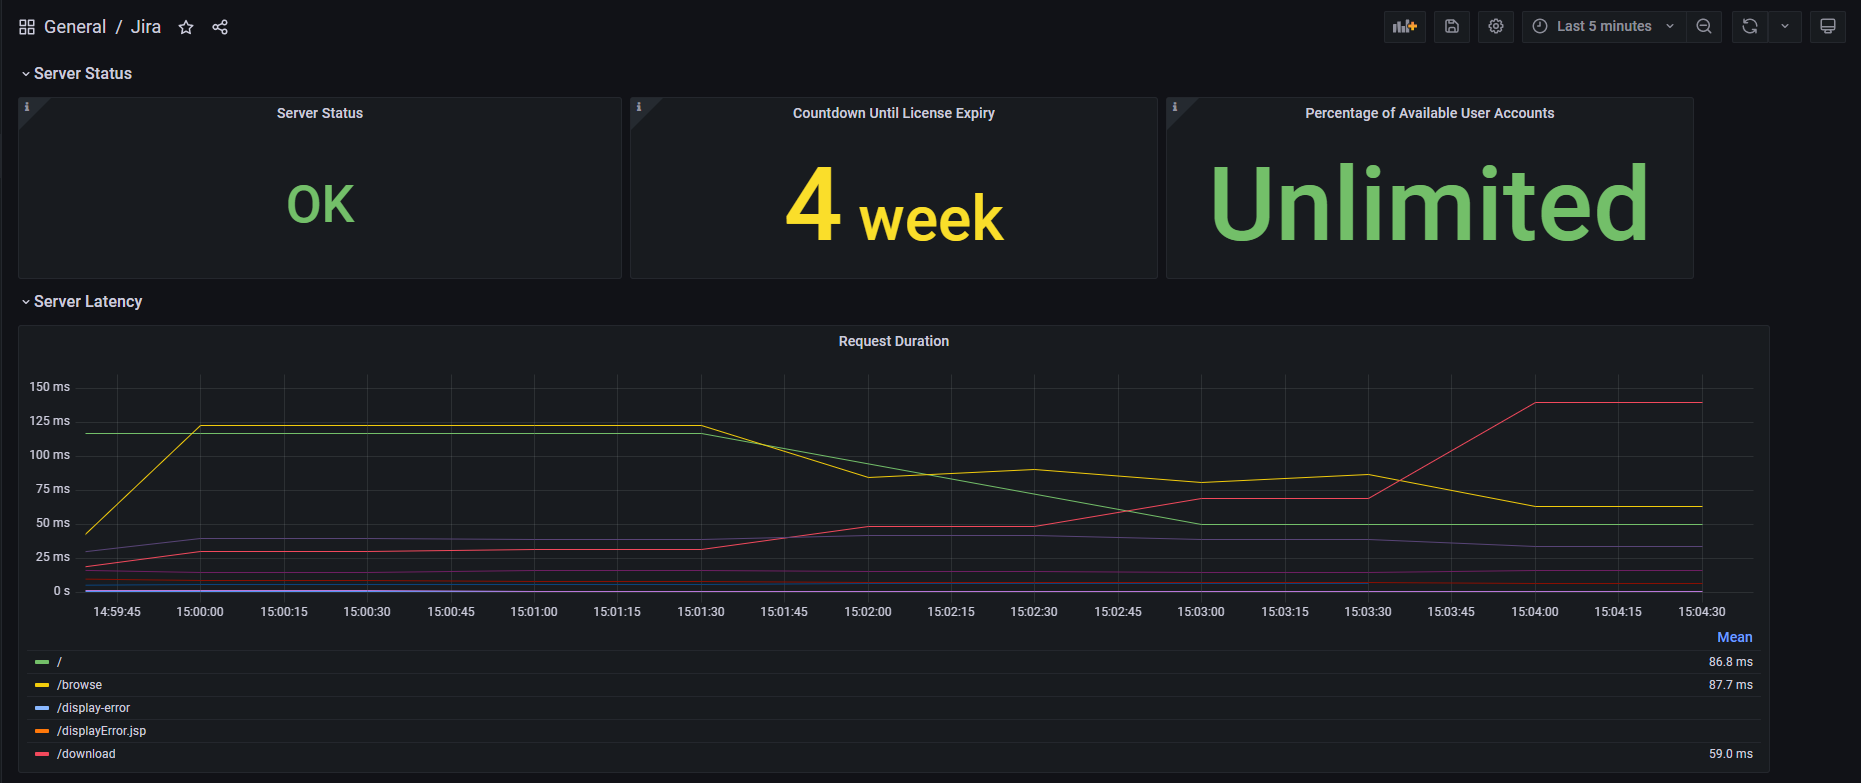
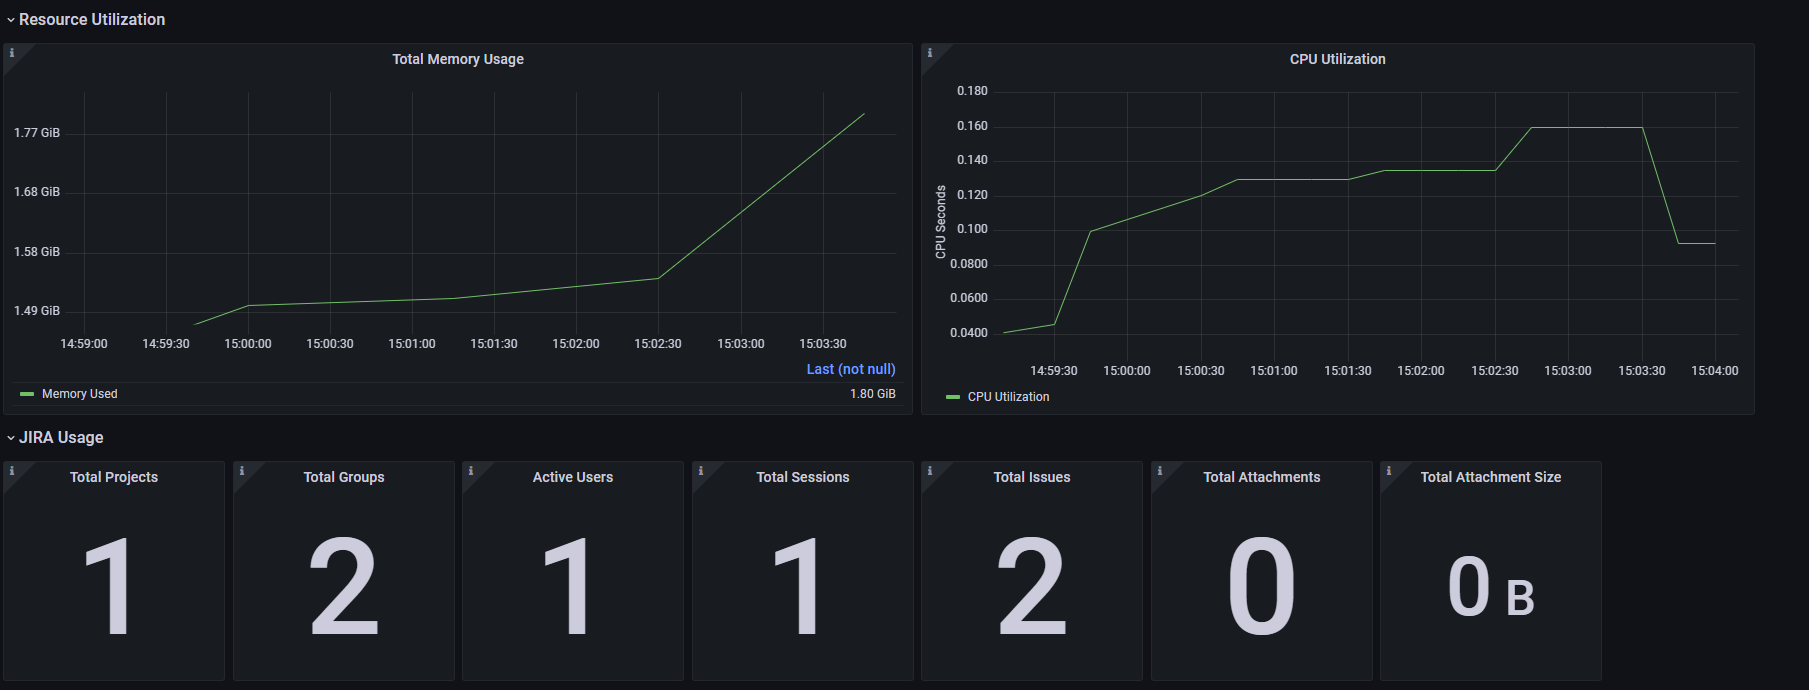
This dashboard is meant to help monitor the health of a JIRA server. It is based on the metrics exported by the JIRA Prometheus Exporter.
Prometheus Exporter
This dashboard relies on the usage of the JIRA prometheus exporter.
On the Atlassian Marketplace, there is a free version of the exporter if you are running your own JIRA server and a pro version if you are running on a hosted JIRA server.
Data source config
Collector type:
Collector plugins:
Collector config:
Dashboard revisions
Upload an updated version of an exported dashboard.json file from Grafana
| Revision | Decscription | Created | |
|---|---|---|---|
| Download |
Sign up for Grafana Cloud

Get up and running in minutes with the Grafana Cloud free tier, which includes free forever 10k metrics, 50GB logs, 50GB traces, 500 VUh, and more.
Get this dashboard
Data source:
Dependencies: