Node.js and Express Metrics
Metrics for node.js and express router status
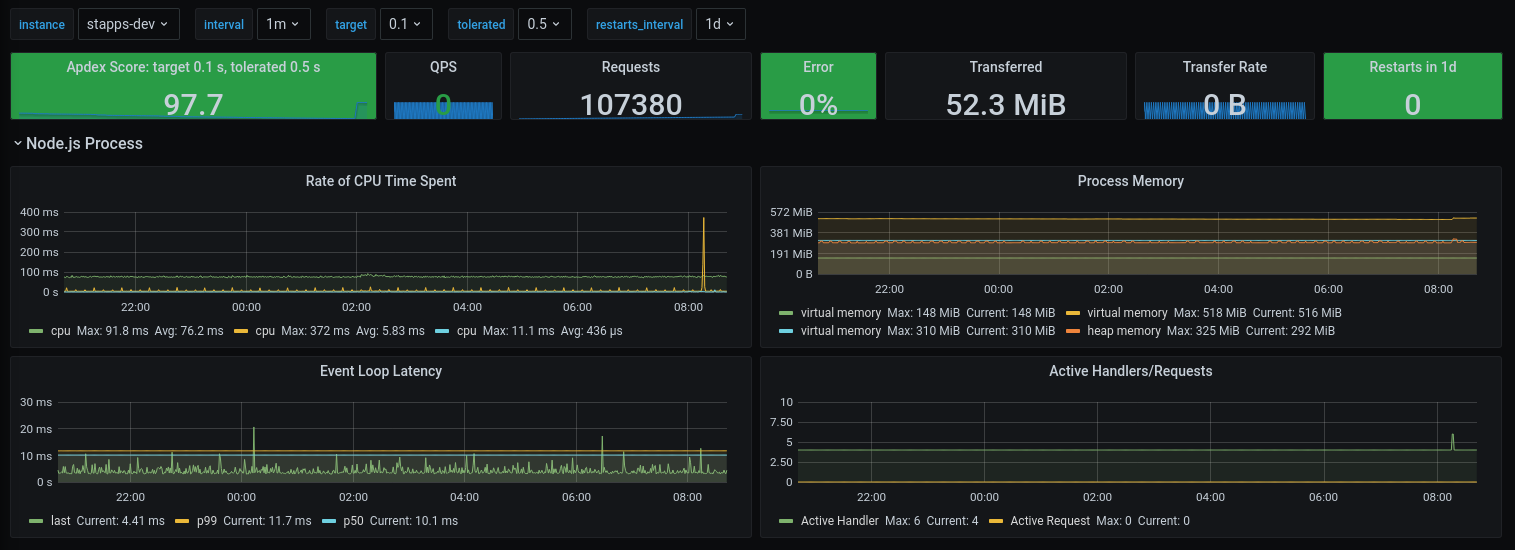
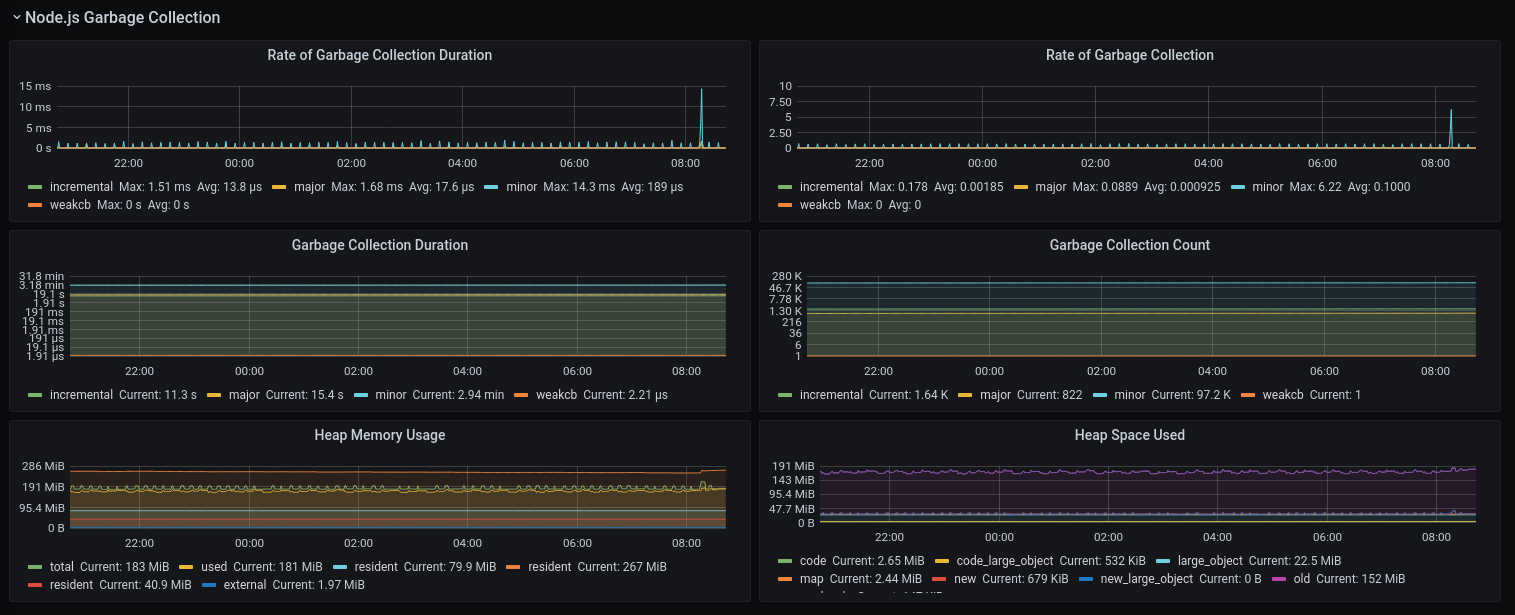
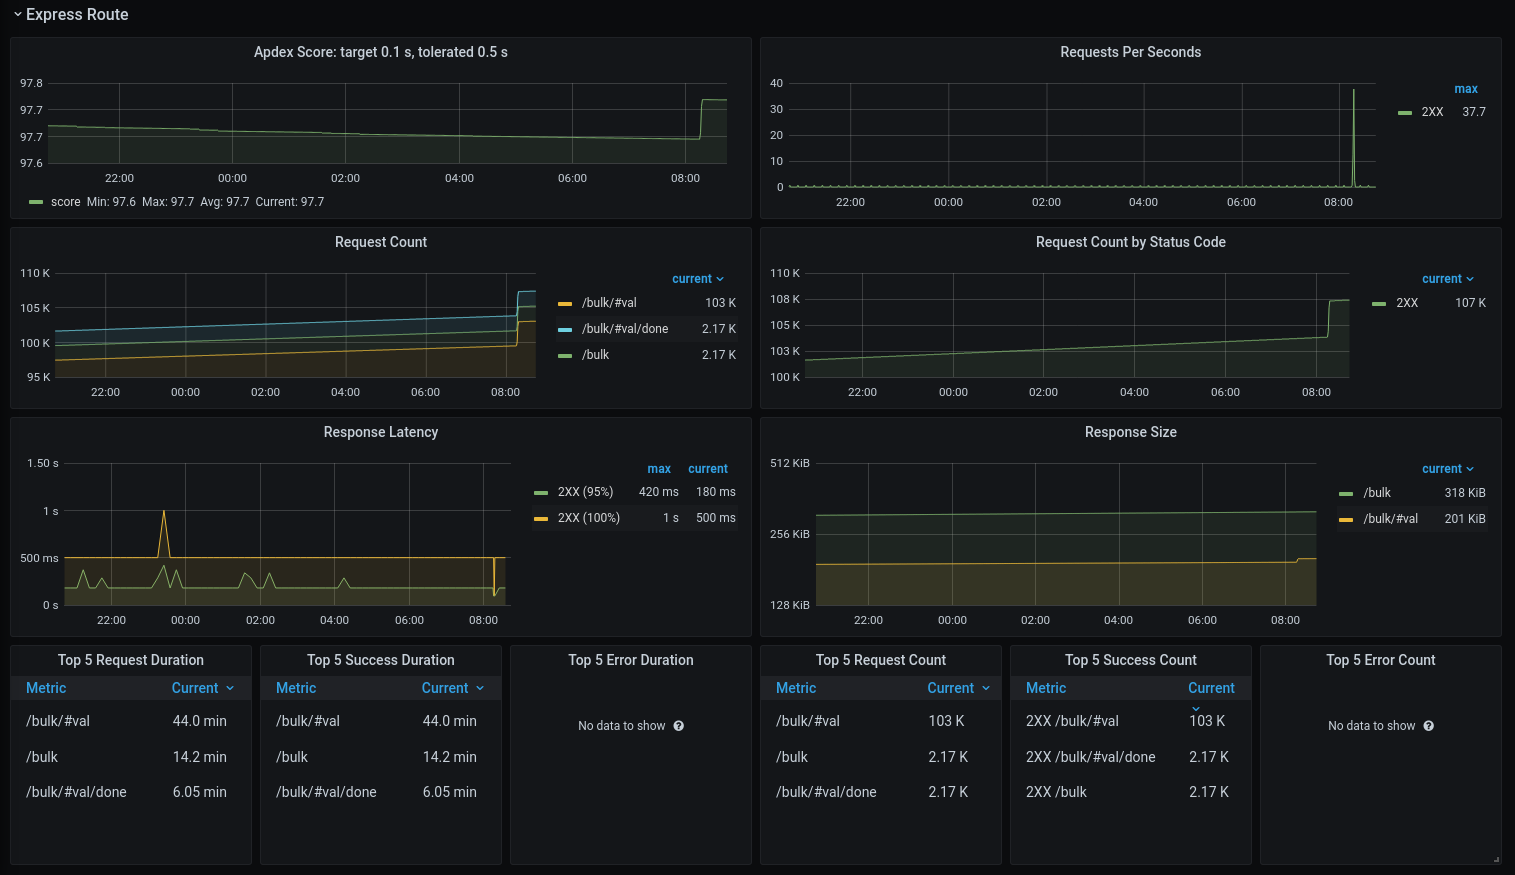
This dashboard displays Node.js metrics collected with Express Prometheus Middleware.
Data source config
Collector type:
Collector plugins:
Collector config:
Revisions
Upload an updated version of an exported dashboard.json file from Grafana
| Revision | Description | Created | |
|---|---|---|---|
| Download |