Bull Queue Dashboard
Dashboard for bull queue metrics. To be used with https://hub.docker.com/r/ejhayes/nodejs-bull-monitor
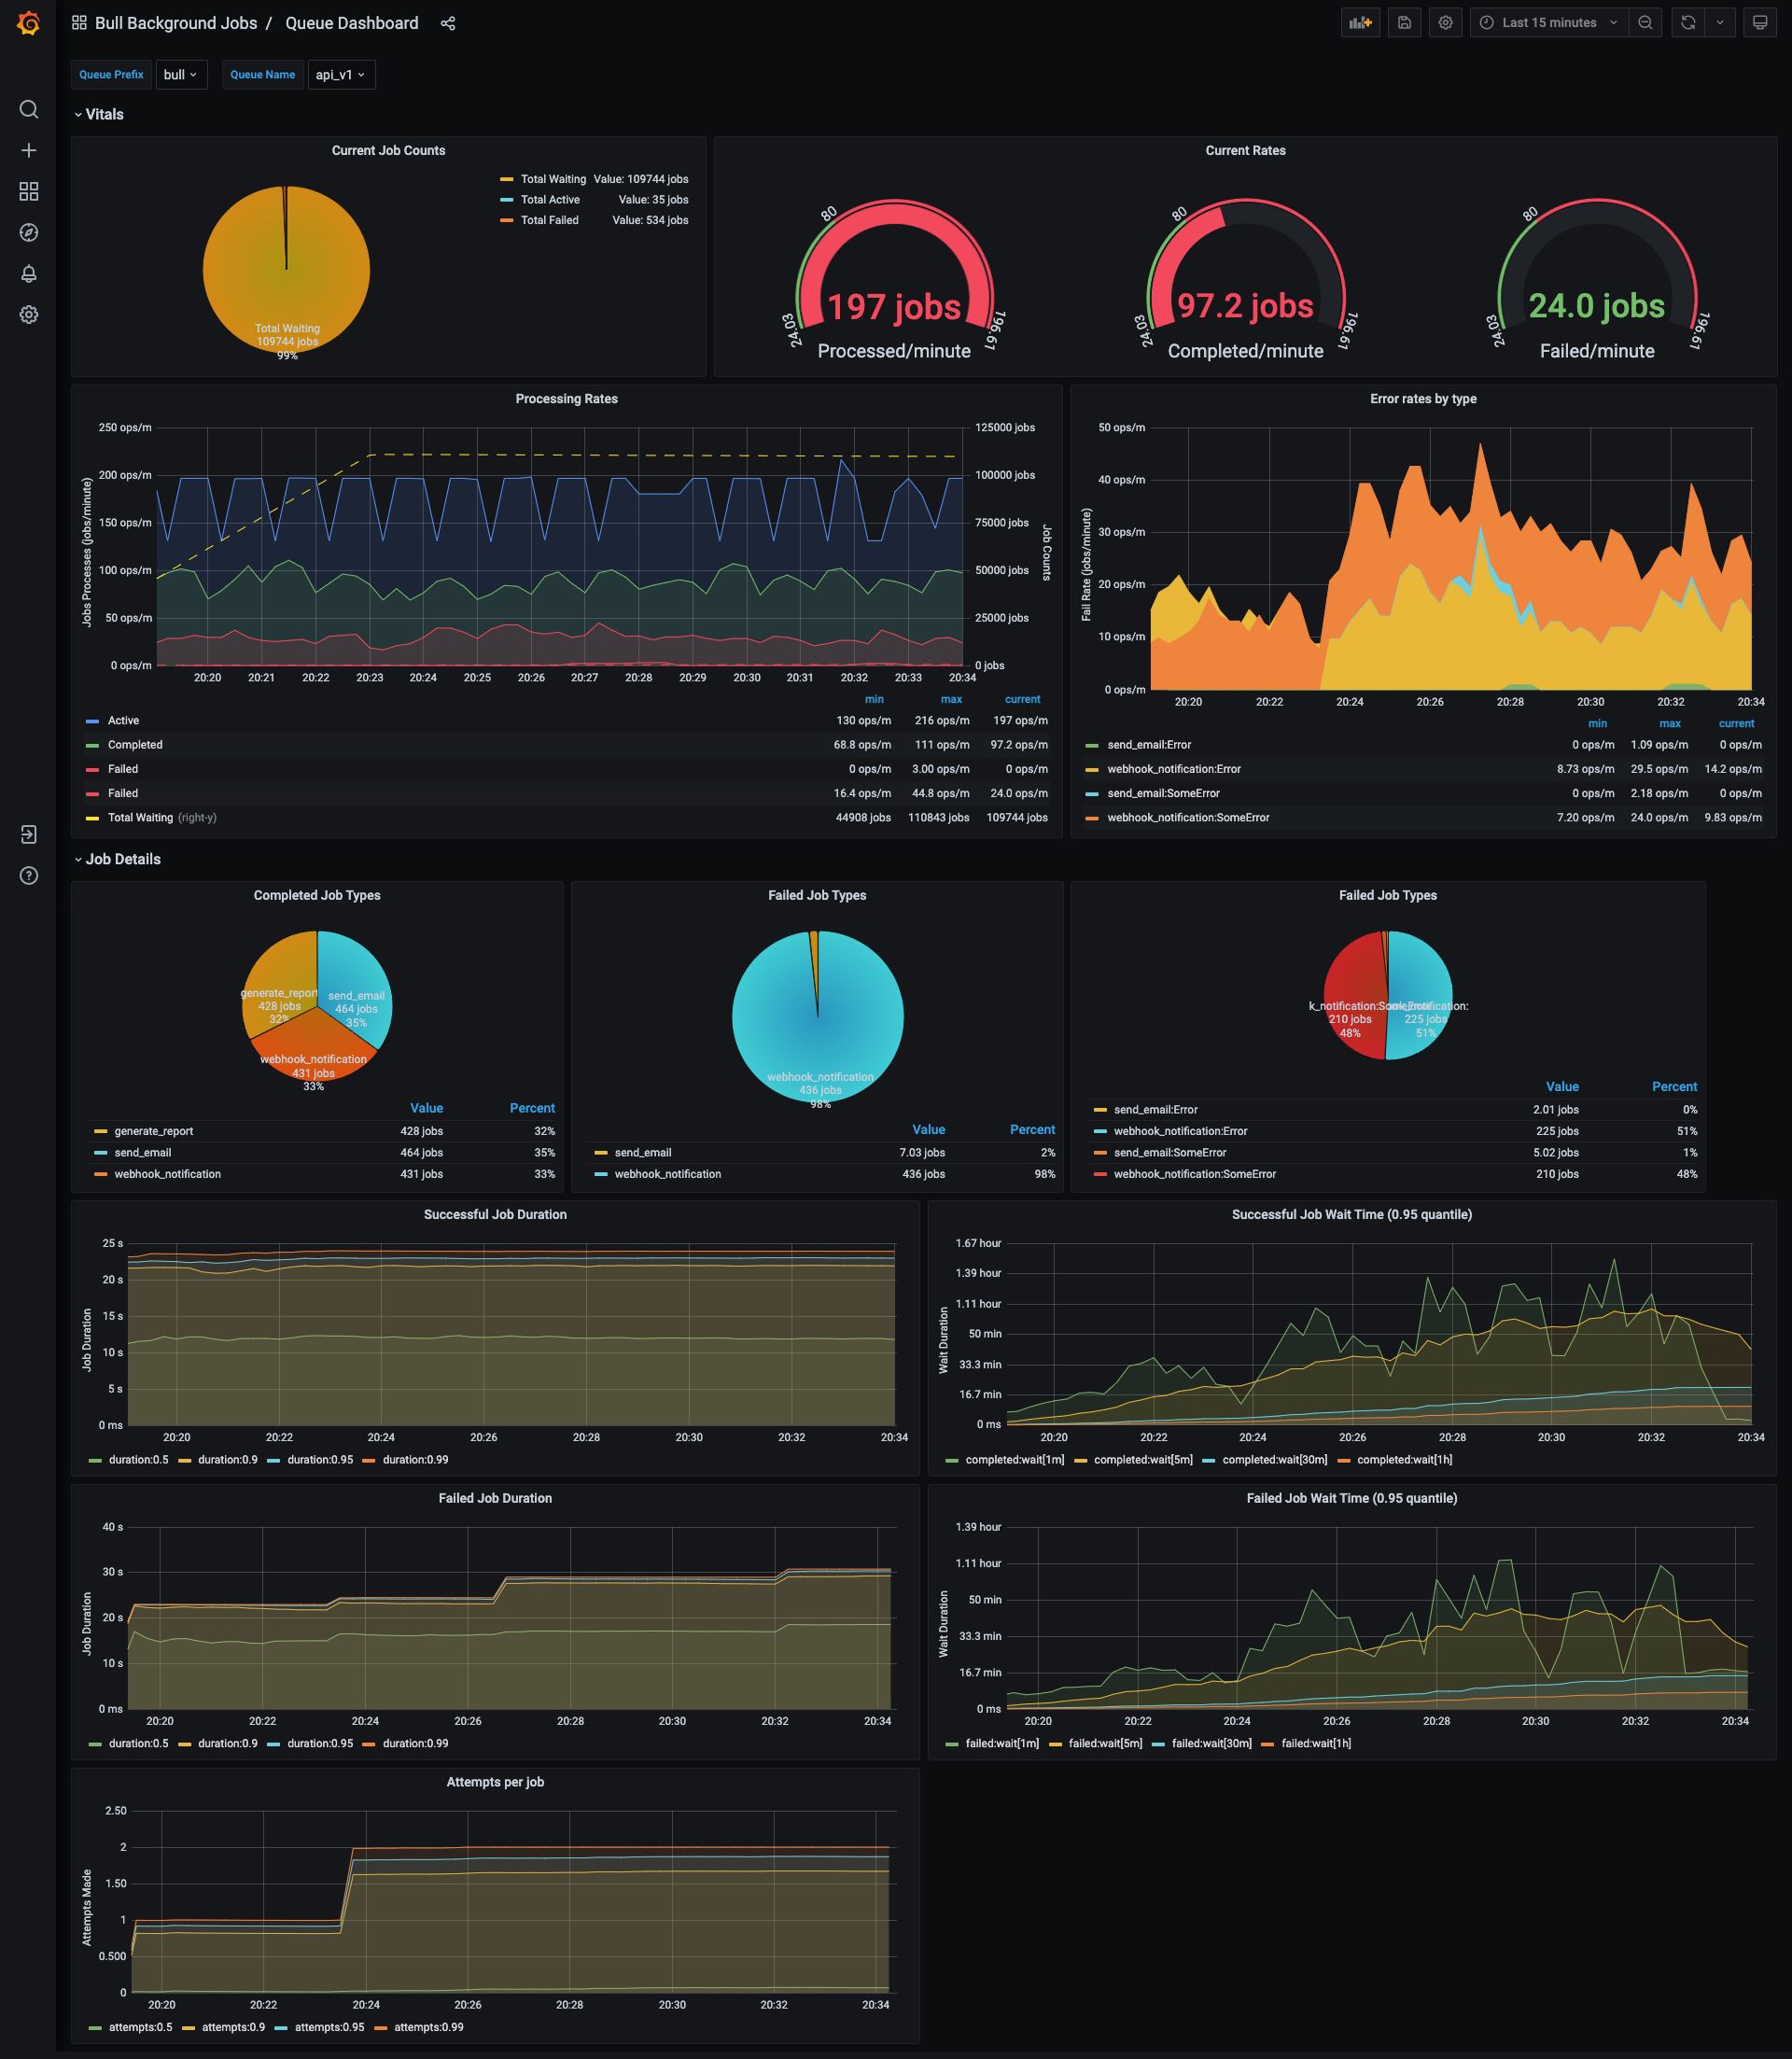
The Bull Queue Dashboard dashboard uses the prometheus data source to create a Grafana dashboard with the gauge, graph and piechart panels.
Data source config
Collector type:
Collector plugins:
Collector config:
Revisions
Upload an updated version of an exported dashboard.json file from Grafana
| Revision | Description | Created | |
|---|---|---|---|
| Download |