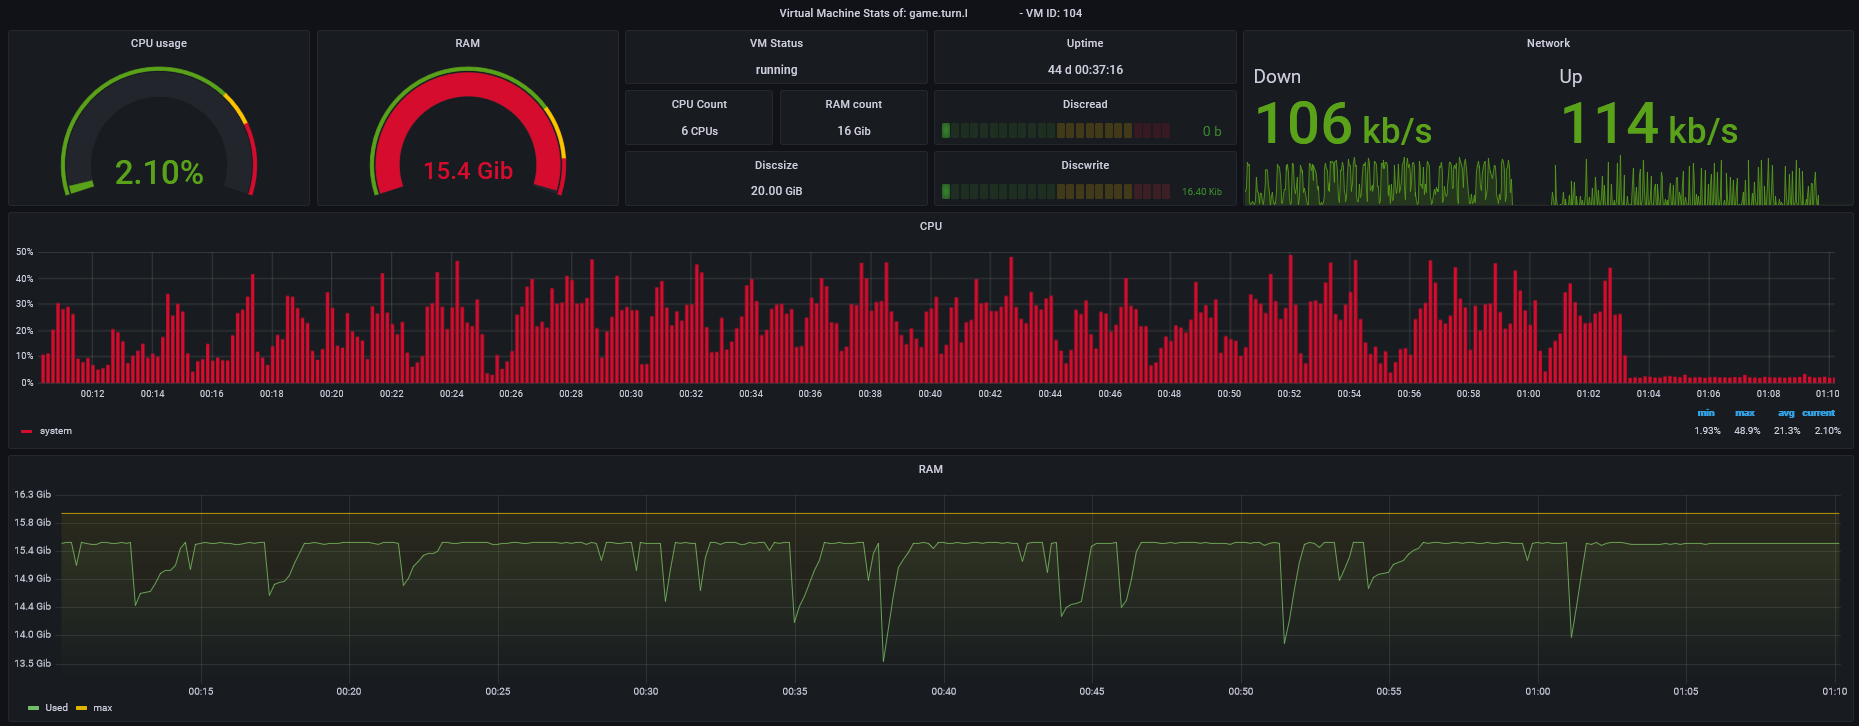
Proxmox VM Einzelmonitor
A Dashboard for monitoring a Proxmox Host and a single VM
You would need to install telegraf on your Proxmox hostsstem. Additionally you would need to setup a metric server on your proxmox-control-dashboard. The proxmox plugin would needed to be activated on your InfluxDB config.
Add this to your Influx config
[[udp]]
enabled = true
bind-address = "0.0.0.0:8089"
database = "proxmox"
batch-size = 1000
batch-timeout = "1s"
Data source config
Collector config:
Upload an updated version of an exported dashboard.json file from Grafana
| Revision | Description | Created | |
|---|---|---|---|
| Download |


