
Mikrotik monitoring
Mikrotik monitoring (support 9.0.5) added w60G
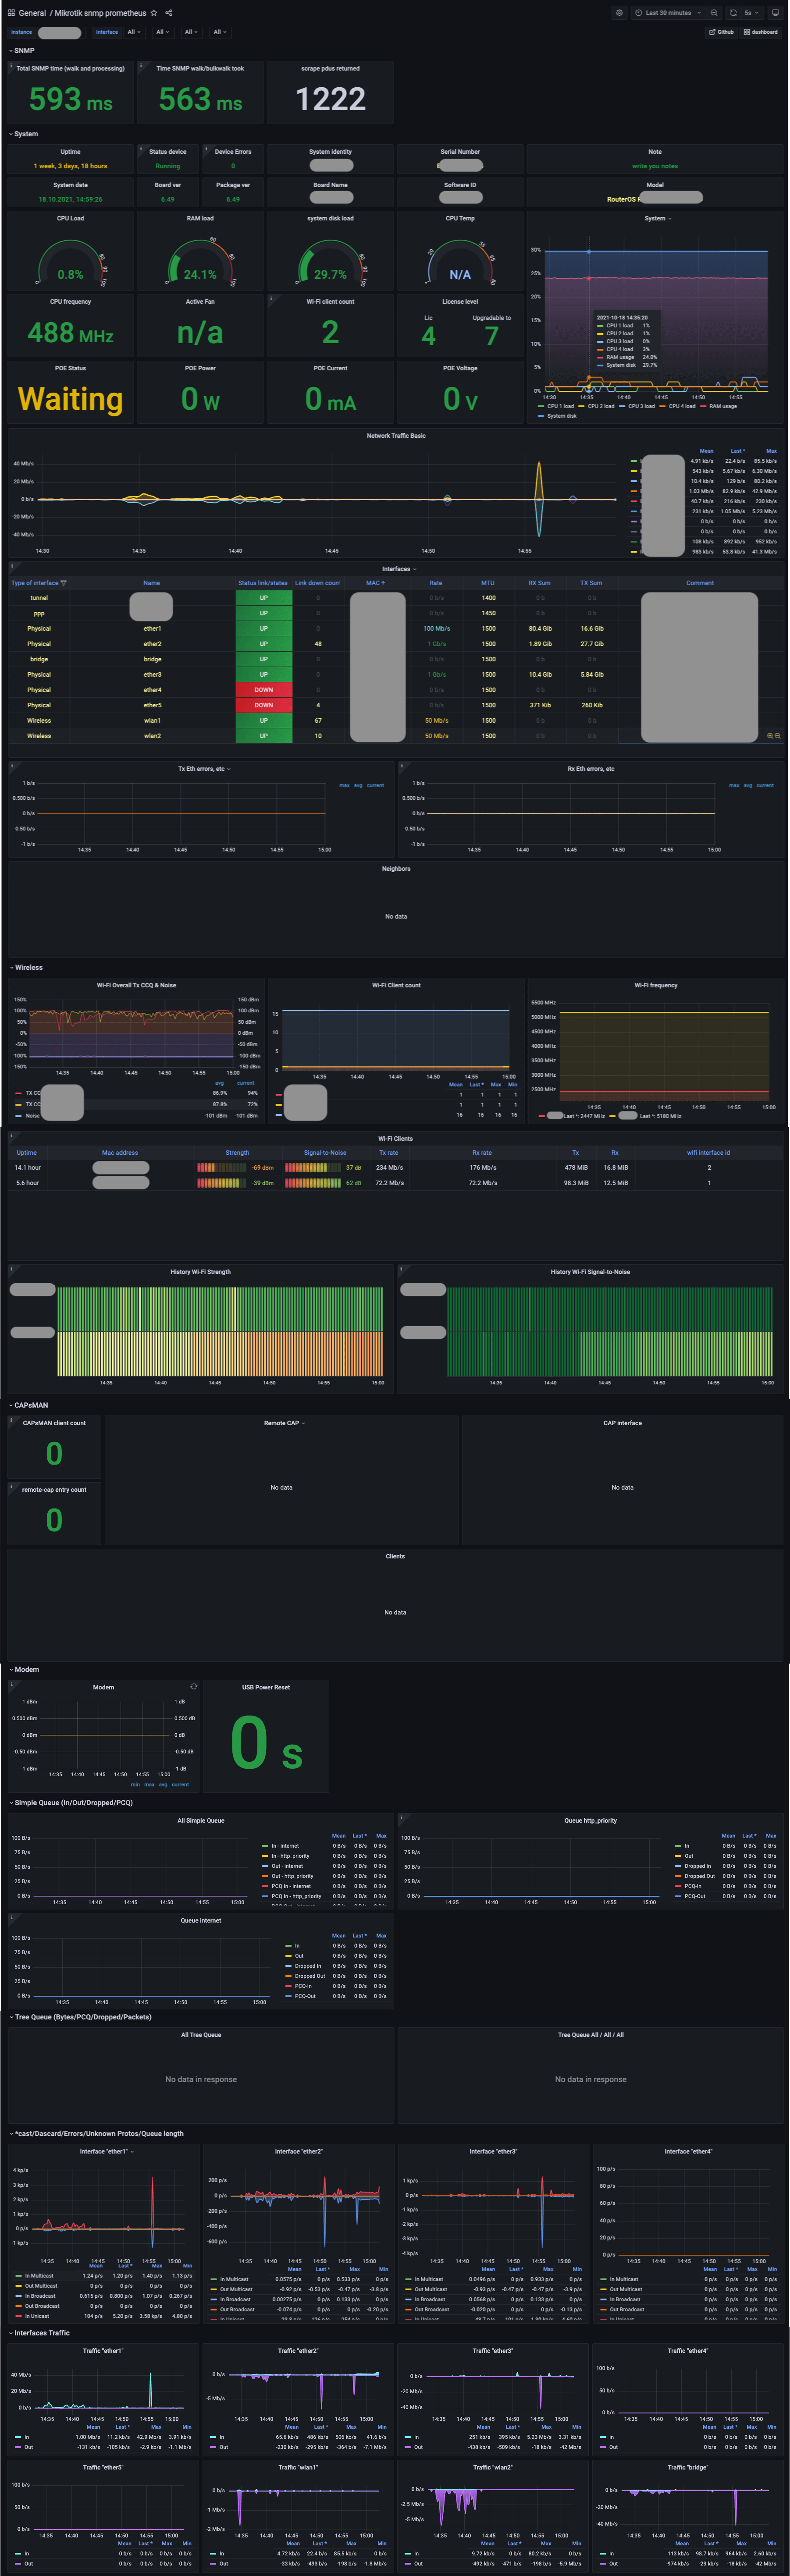
Grafana dashboard for mikrotik
![]()

What’s new ?
- added 60GHz monitoring
? Deploy with docker-compose (grafana+prometheus+snmp_exporter)
deploy with bash script
curl -fsSL https://raw.githubusercontent.com/IgorKha/Grafana-Mikrotik/master/run.sh | bash -s -- --configYou can also pass some arguments to script to set some these options:
–config: change the user and password to grafana and specify the mikrotik IP address
stop: stop docker containers
–help
For example:
bash run.sh --config
deploy with docker-compose manual
- clone repository
git clone https://github.com/IgorKha/Grafana-Mikrotik.git && cd Grafana-Mikrotik- Change targets ip (192.168.88.1) into file prometheus/prometheus.yml
nano prometheus/prometheus.yml- Run docker-compose
docker-compose up -d- Open localhost:3000
Grafana:
login:
adminpassword:
mikrotik
If you want to change the credentials, then edit the .env file
More information
Data source config
Collector type:
Collector plugins:
Collector config:
Dashboard revisions
Upload an updated version of an exported dashboard.json file from Grafana
| Revision | Decscription | Created | |
|---|---|---|---|
| Download |
Sign up for Grafana Cloud

Get up and running in minutes with the Grafana Cloud free tier, which includes free forever 10k metrics, 50GB logs, 50GB traces, 500 VUh, and more.
Get this dashboard
Data source:
Dependencies: