Banu WoMo
Victron Energy Venus Dashboard
2022 - February
New: Needs now Grafana 8
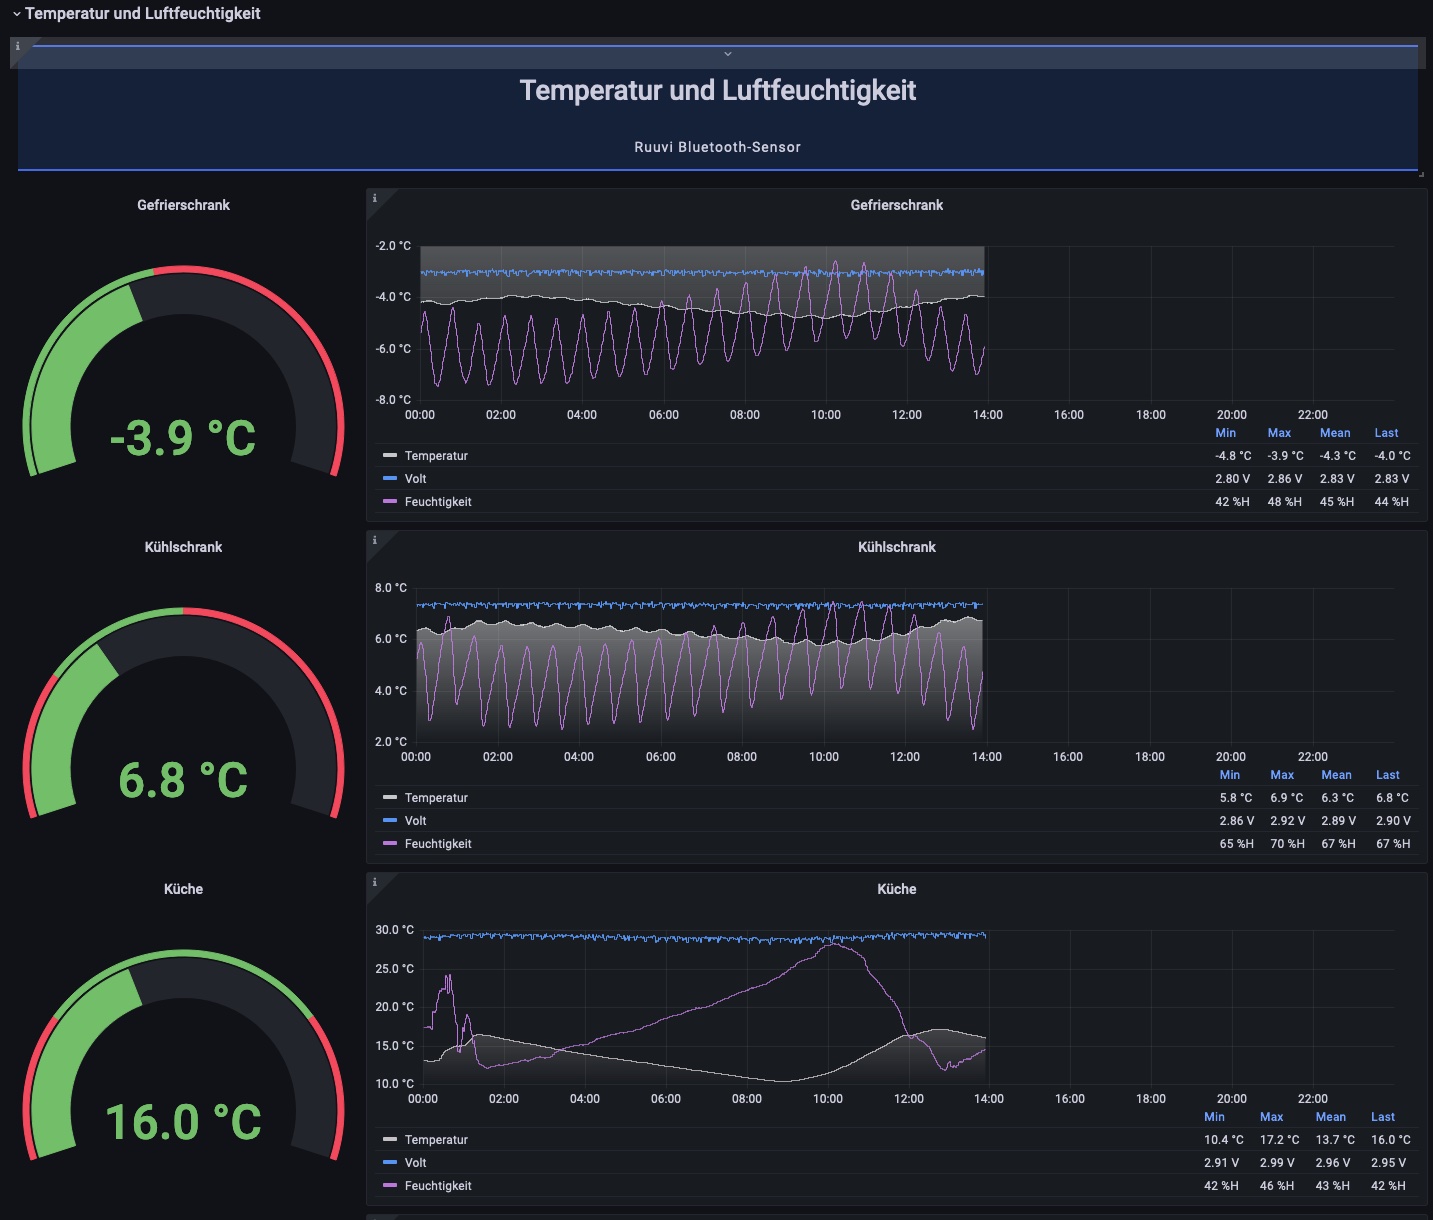
New: Ruuvi Bluetooth Sensors
Update: Switched mostly from Graph panel to Time series panel.
Update: Design works also on small screens from smartphones or pads
2021 - May
Victron Energy is a Dutch manufacturer of MPPT solar controllers, inverters, LiFePO4 batteries, charging boosters and much more. All information on the Victron Remote Management website is collected via a GX device and displayed on a website. (https://vrm.victronenergy.com/world)
Victron Energy offers Docker Images that transfer this data to a local InfluxDB and display it with the help of Grafana.
This dashboard is for Grafana 7.5.
The Victron Energy installation includes:
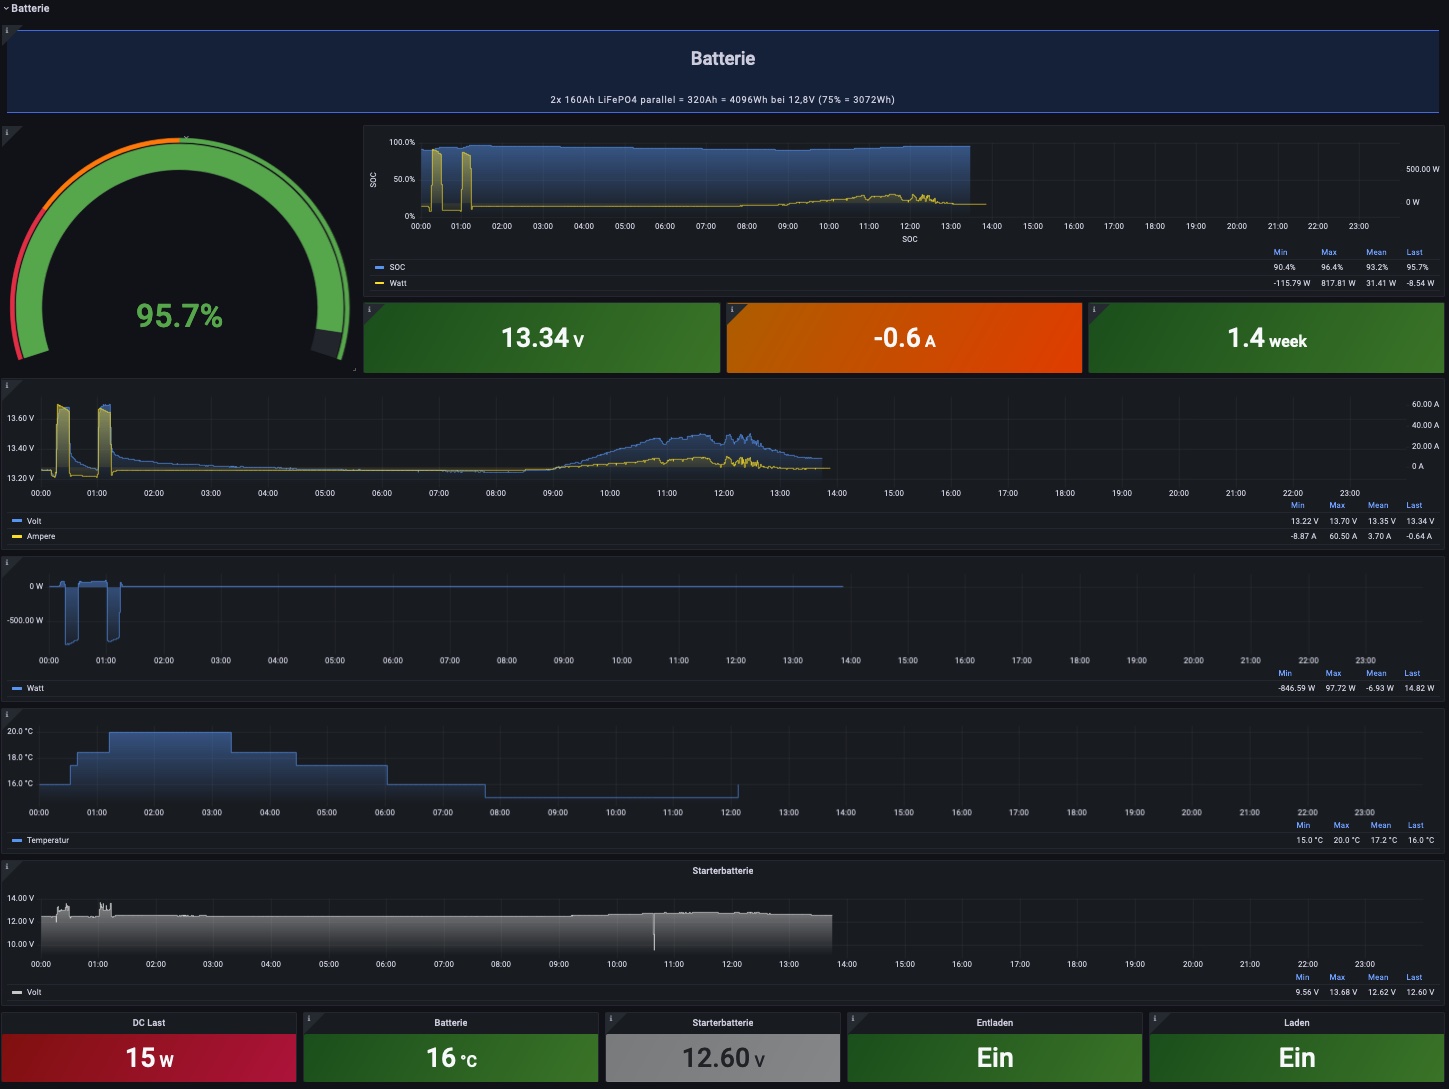
- LiFePO4 batteries (https://www.victronenergy.com/batteries/lithium-battery-12-8v)
- VE.Bus BMS (https://www.victronenergy.com/battery-management-systems/ve-bus-bms)
- Smart Shunt (https://www.victronenergy.com/battery-monitors/smart-battery-shunt)
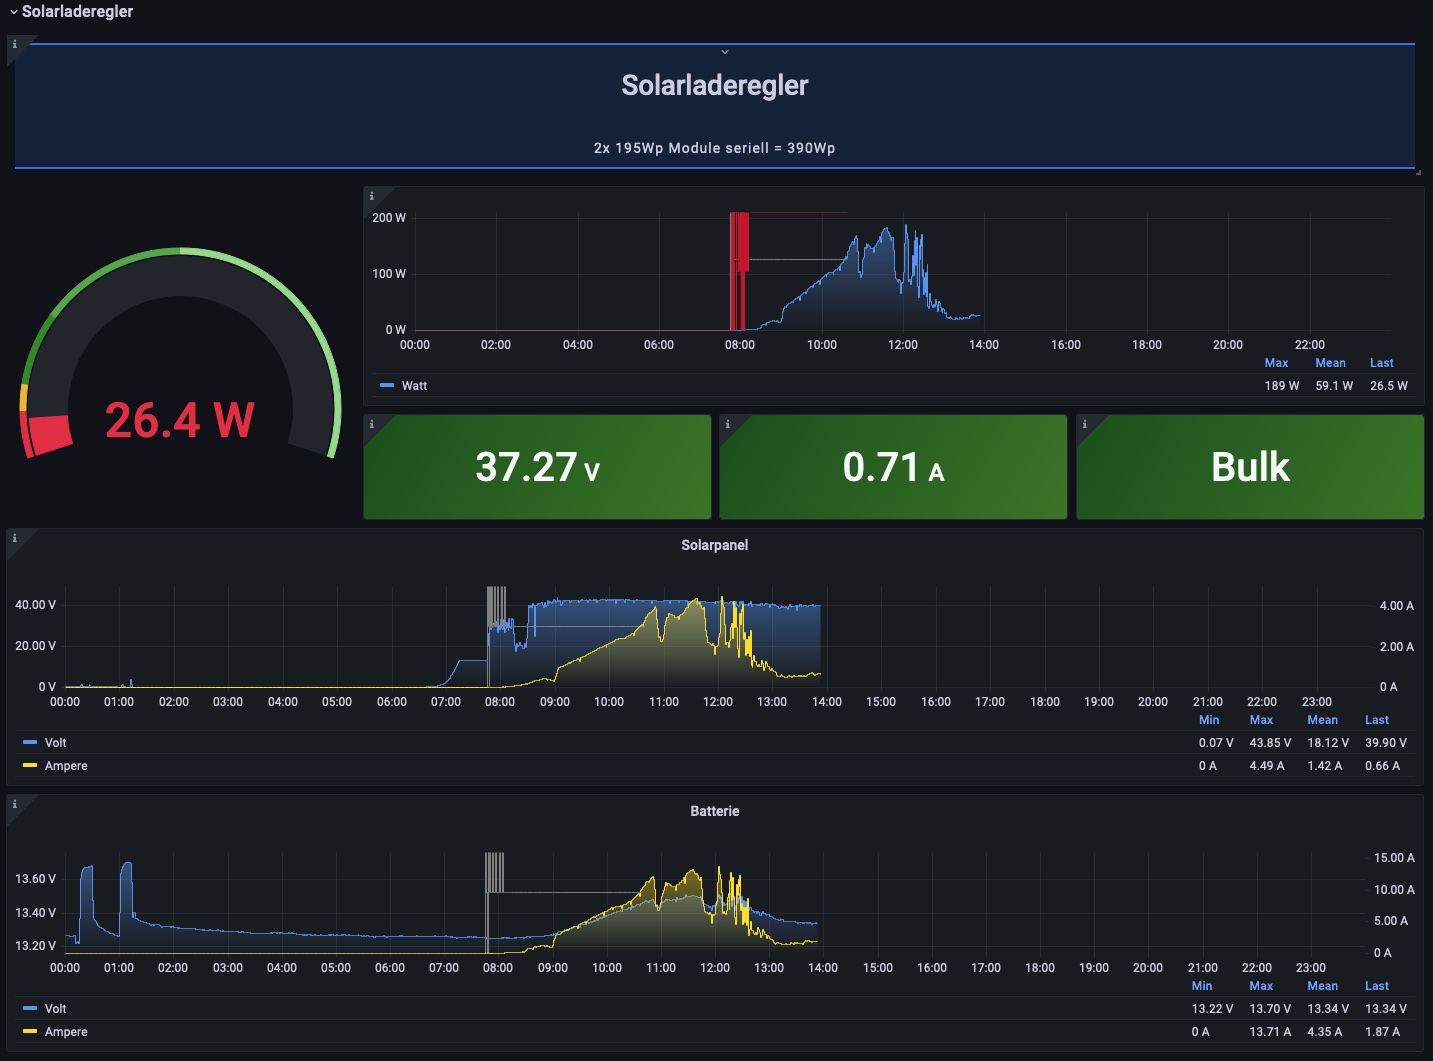
- Smart MPPT solar charge controller (https://www.victronenergy.com/solar-charge-controllers/smartsolar-100-30-100-50)
- MultiPlus Compact 12/2000 / 80-30 (https://www.victronenergy.com/inverters-chargers/multiplus-12v-24v-48v-800va-3kva)
- Cerbo GX (https://www.victronenergy.com/panel-systems-remote-monitoring/cerbo-gx)
- GX Touch 50 (https://www.victronenergy.com/panel-systems-remote-monitoring/gx-touch-50)
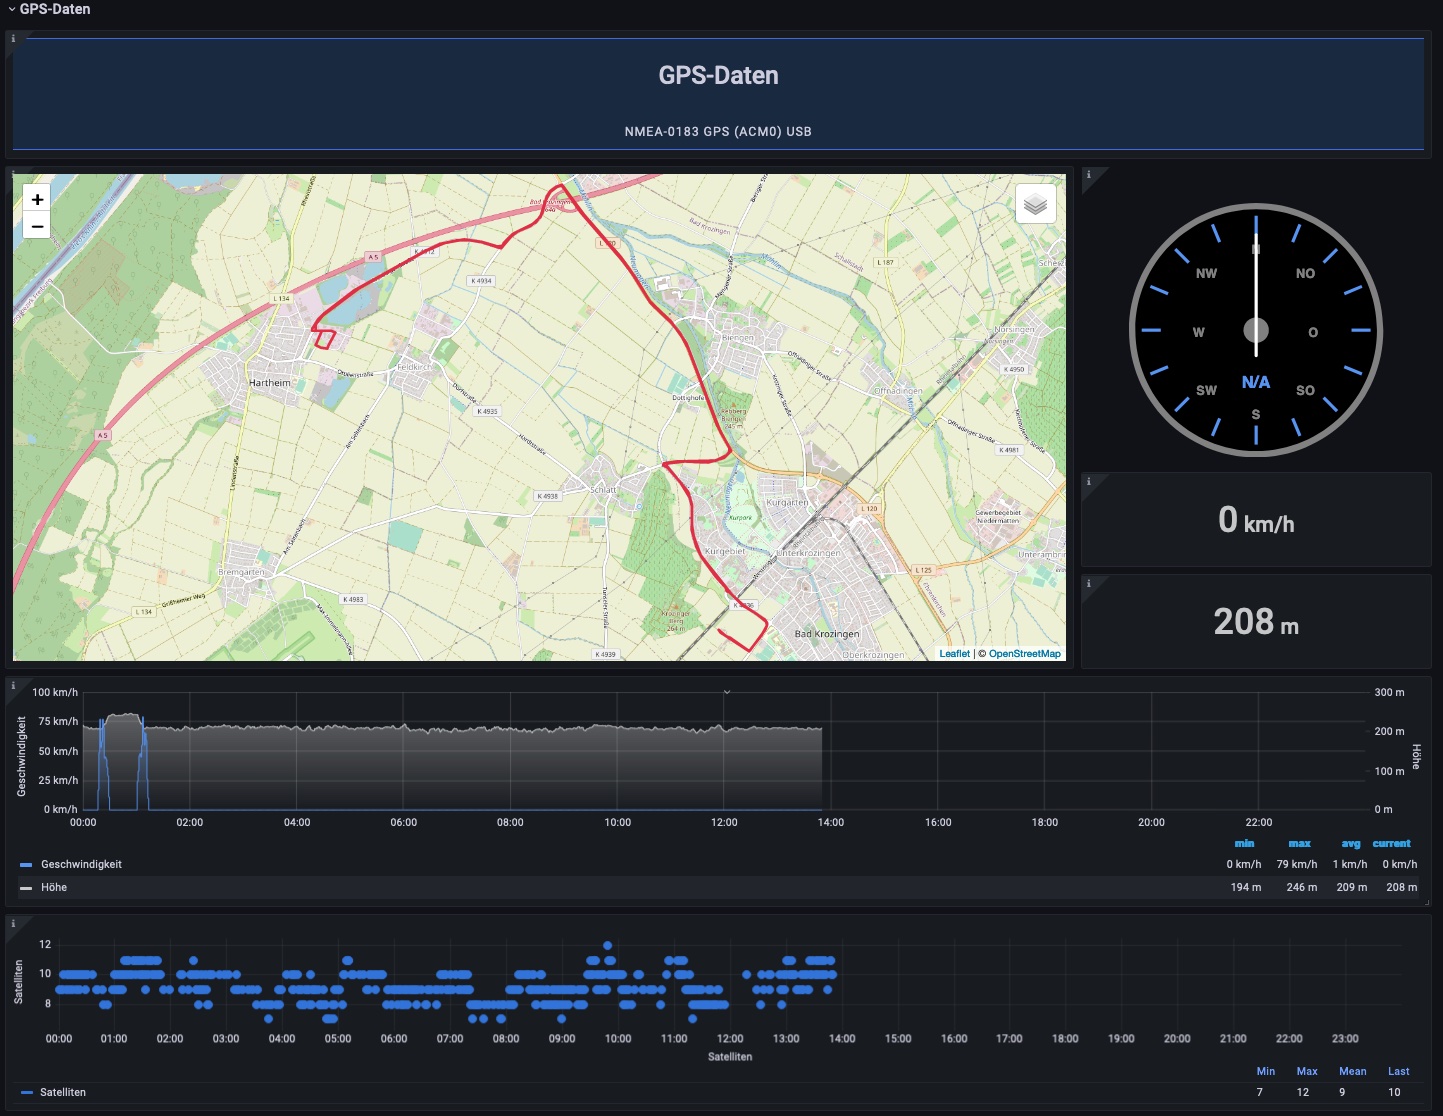
- Simple USB GPS mouse
The dashboard is divided into different sections:
- GPS data
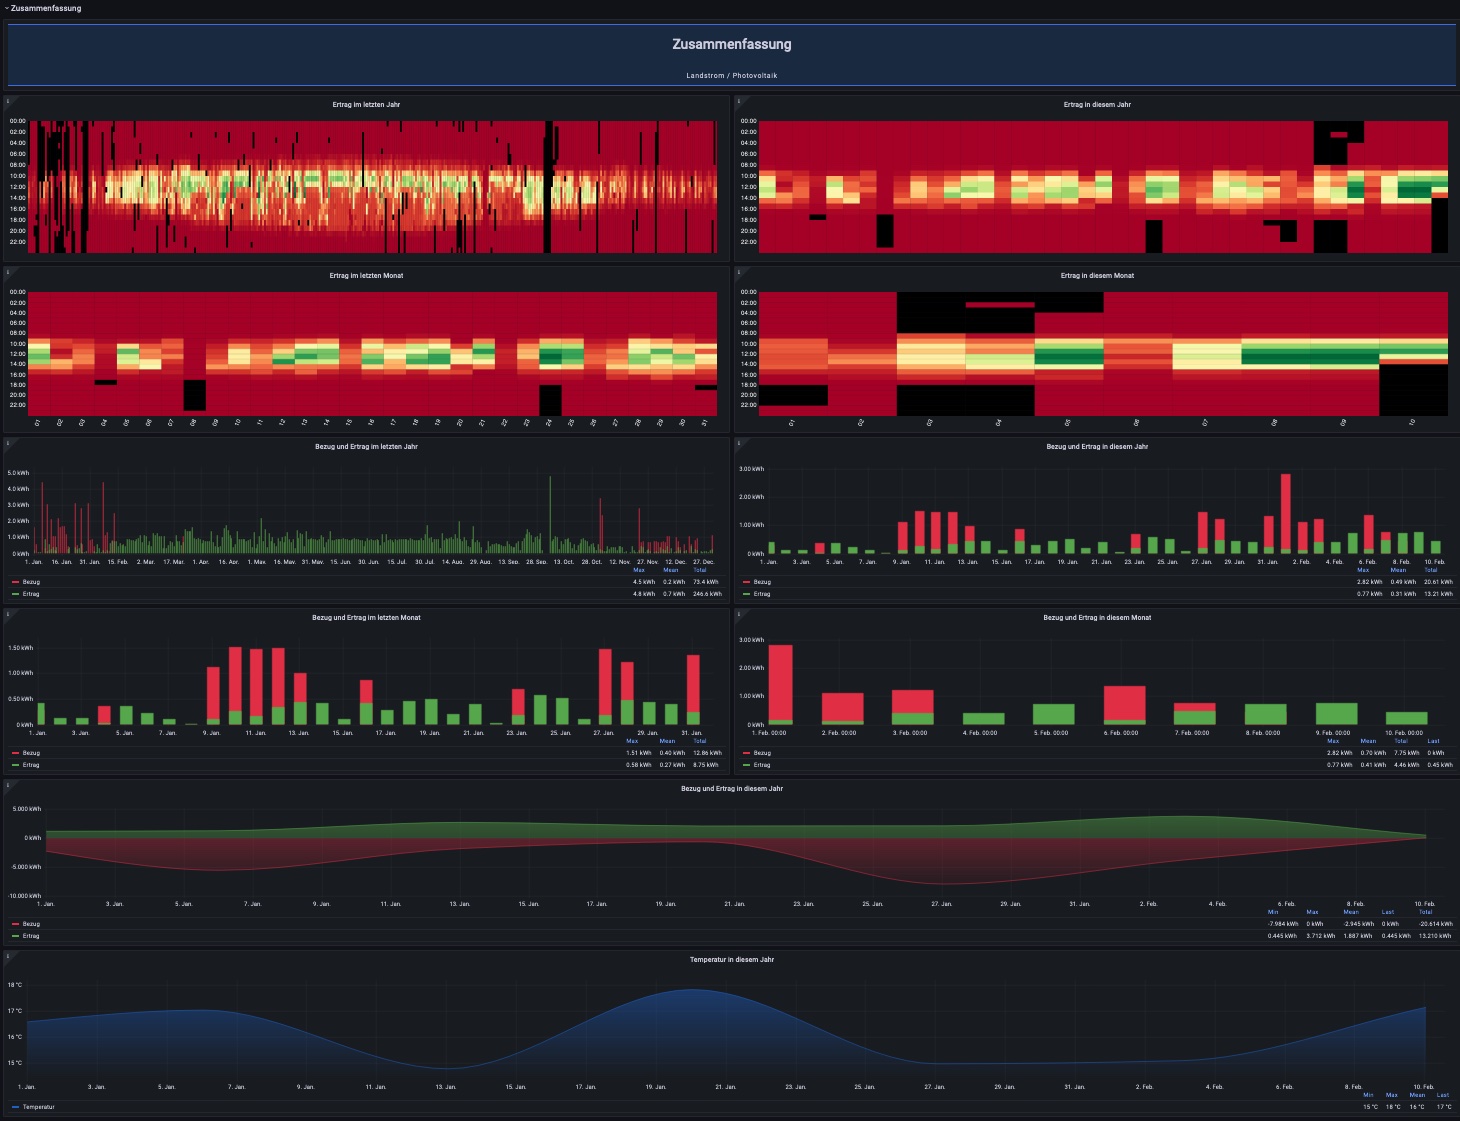
- Summary
- battery
- Solar charge controller
- Inverter output
- Inverter input
The dashboard can be viewed here: https://www.zoomsoft.de/grafana
We use Grafana, Telegraf and Prometheus to monitor the systems in our data center and those of our customers.
The Victron Energy installation serves to collect experience in the field of photovoltaics, our data center should be 100% self-sufficient.
If you have any questions, please ask in the Victron Energy Forum. (https://community.victronenergy.com/index.html) I want to try to answer all questions in this dashboard.
Data source config
Collector config:
Upload an updated version of an exported dashboard.json file from Grafana
| Revision | Description | Created | |
|---|---|---|---|
| Download |
