iDRAC SNMP DashBoard
A Dashboard for DELL iDRAC based on SNMP_EXPORTER and Prometheus
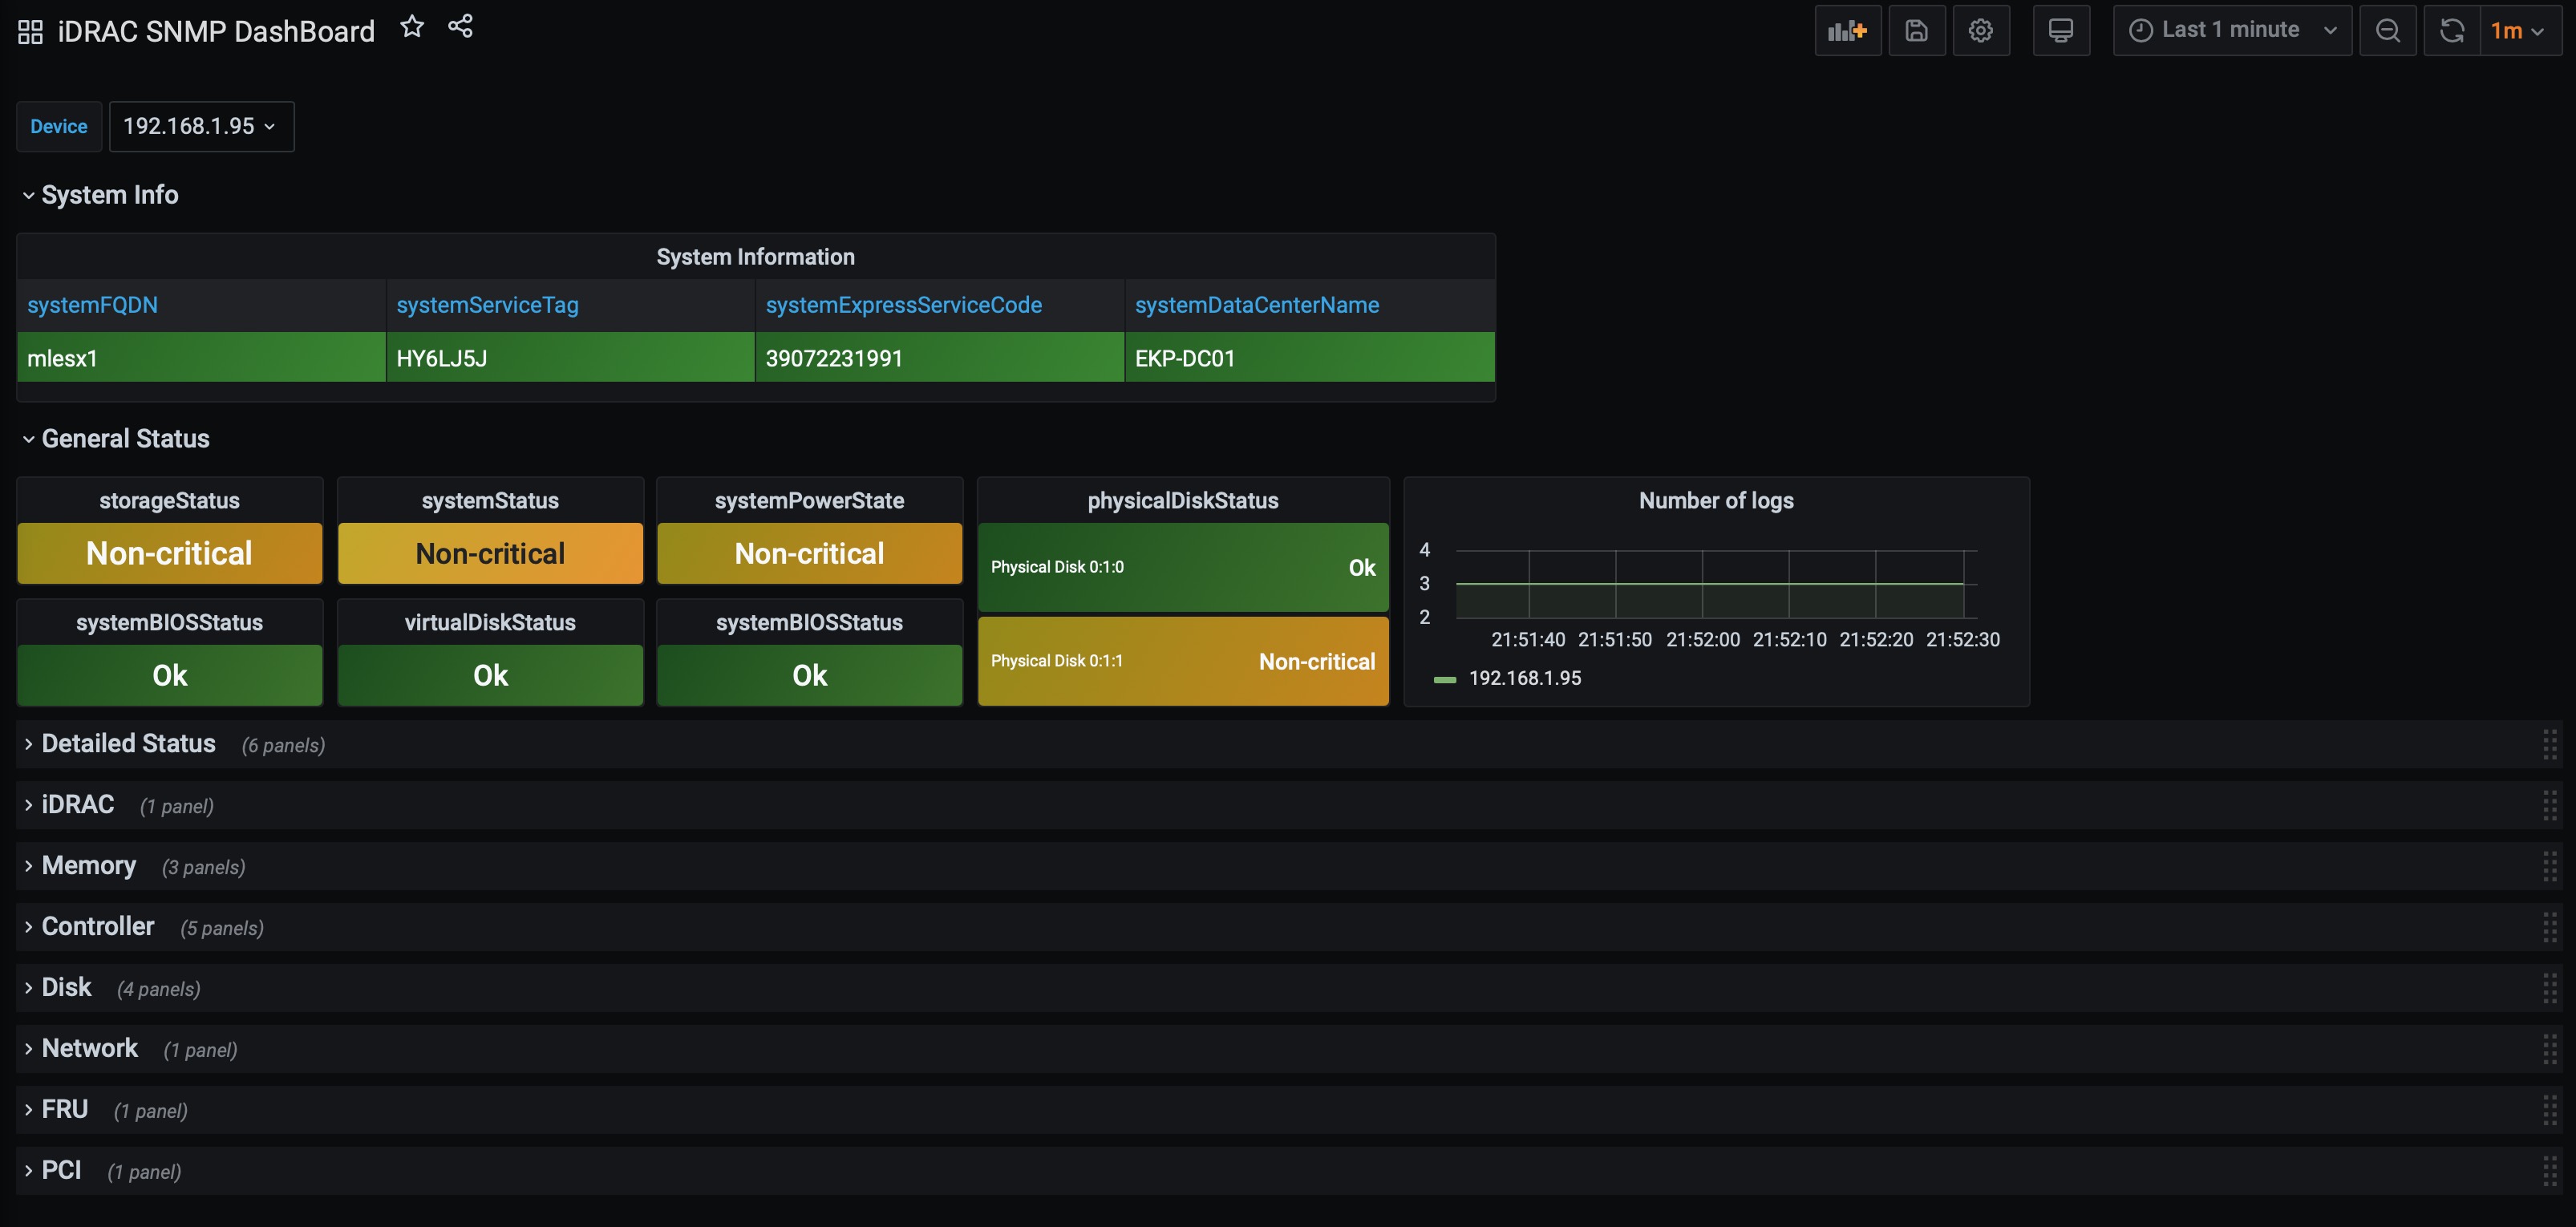
A Dashboard for Dell iDRAC Shows Hardware status for: Storage, Disks, memory, controller, BIOS, Network, PCI, Power and iDRAC. Also shows some Hardware information such as: FQDN, ServiceTag, ServiceCode, FRUs
Dashboard can also be found at https://github.com/zorrzoor/grafana-idrac-dashboard.git At GitHub you can also find the snmp_exporter settings used for this dashboard
Please contribute
Data source config
Collector type:
Collector plugins:
Collector config:
Revisions
Upload an updated version of an exported dashboard.json file from Grafana
| Revision | Description | Created | |
|---|---|---|---|
| Download |
SNMP
Easily monitor any generic SNMP (Simple Network Management Protocol) device with Grafana Cloud's out-of-the-box monitoring solution.
Learn more