WeatherFlow Collector - Device Details
WeatherFlow Collector provides multiple ways of collecting data from the WeatherFlow Tempest, Air, and Sky weather systems. These Grafana dashboards offer visualizations in real-time for current conditions, derived metrics, and forecasting.
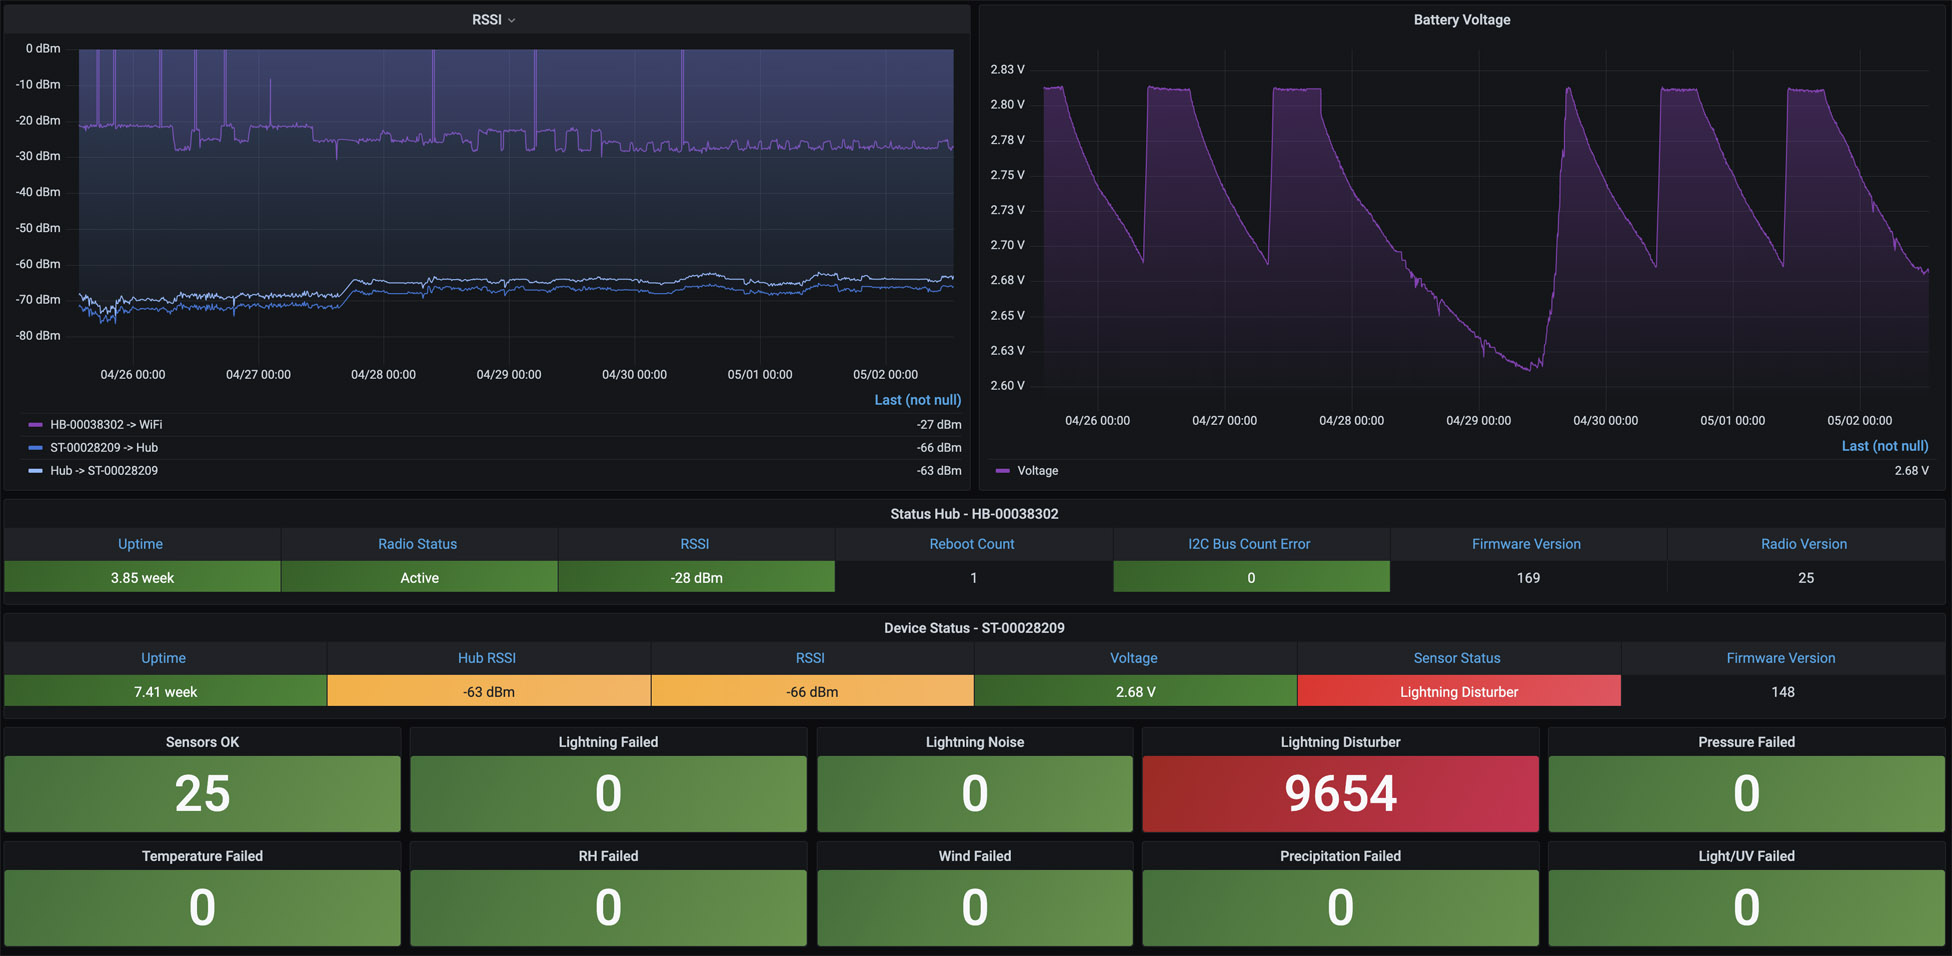
This dashboard provides the current status for both the Tempest and your WeatherFlow hub, such as Uptime, Radio Status, RSSI, Reboot Count, I2C Bus Count Error, Radio Version, Network ID, Firmware Version, and Voltage.
RSSI and Battery Voltage over time defaulted to the last seven days are shown at the top of the dashboard, while current device details are shown below.
Sensor Status measurements are shown with a number related to each per minute collection from the device. Either "Sensors OK" is down or any failures, which sensor had the error. Note that if you have the Lightning Disturber enabled, you may see a high number of failures as electromagnetic interference is being suppressed.
More details on these WeatherFlow Collector dashboards may be found:
- Github Project: https://github.com/lux4rd0/weatherflow-collector/
- Web Site: https://labs.lux4rd0.com/weatherflow-collector/
Data source config
Collector config:
Upload an updated version of an exported dashboard.json file from Grafana
| Revision | Description | Created | |
|---|---|---|---|
| Download |

