DRBD
This example dashboard showcases what can be accomplished using the metrics that the drbd-reactor Prometheus plugin exports.
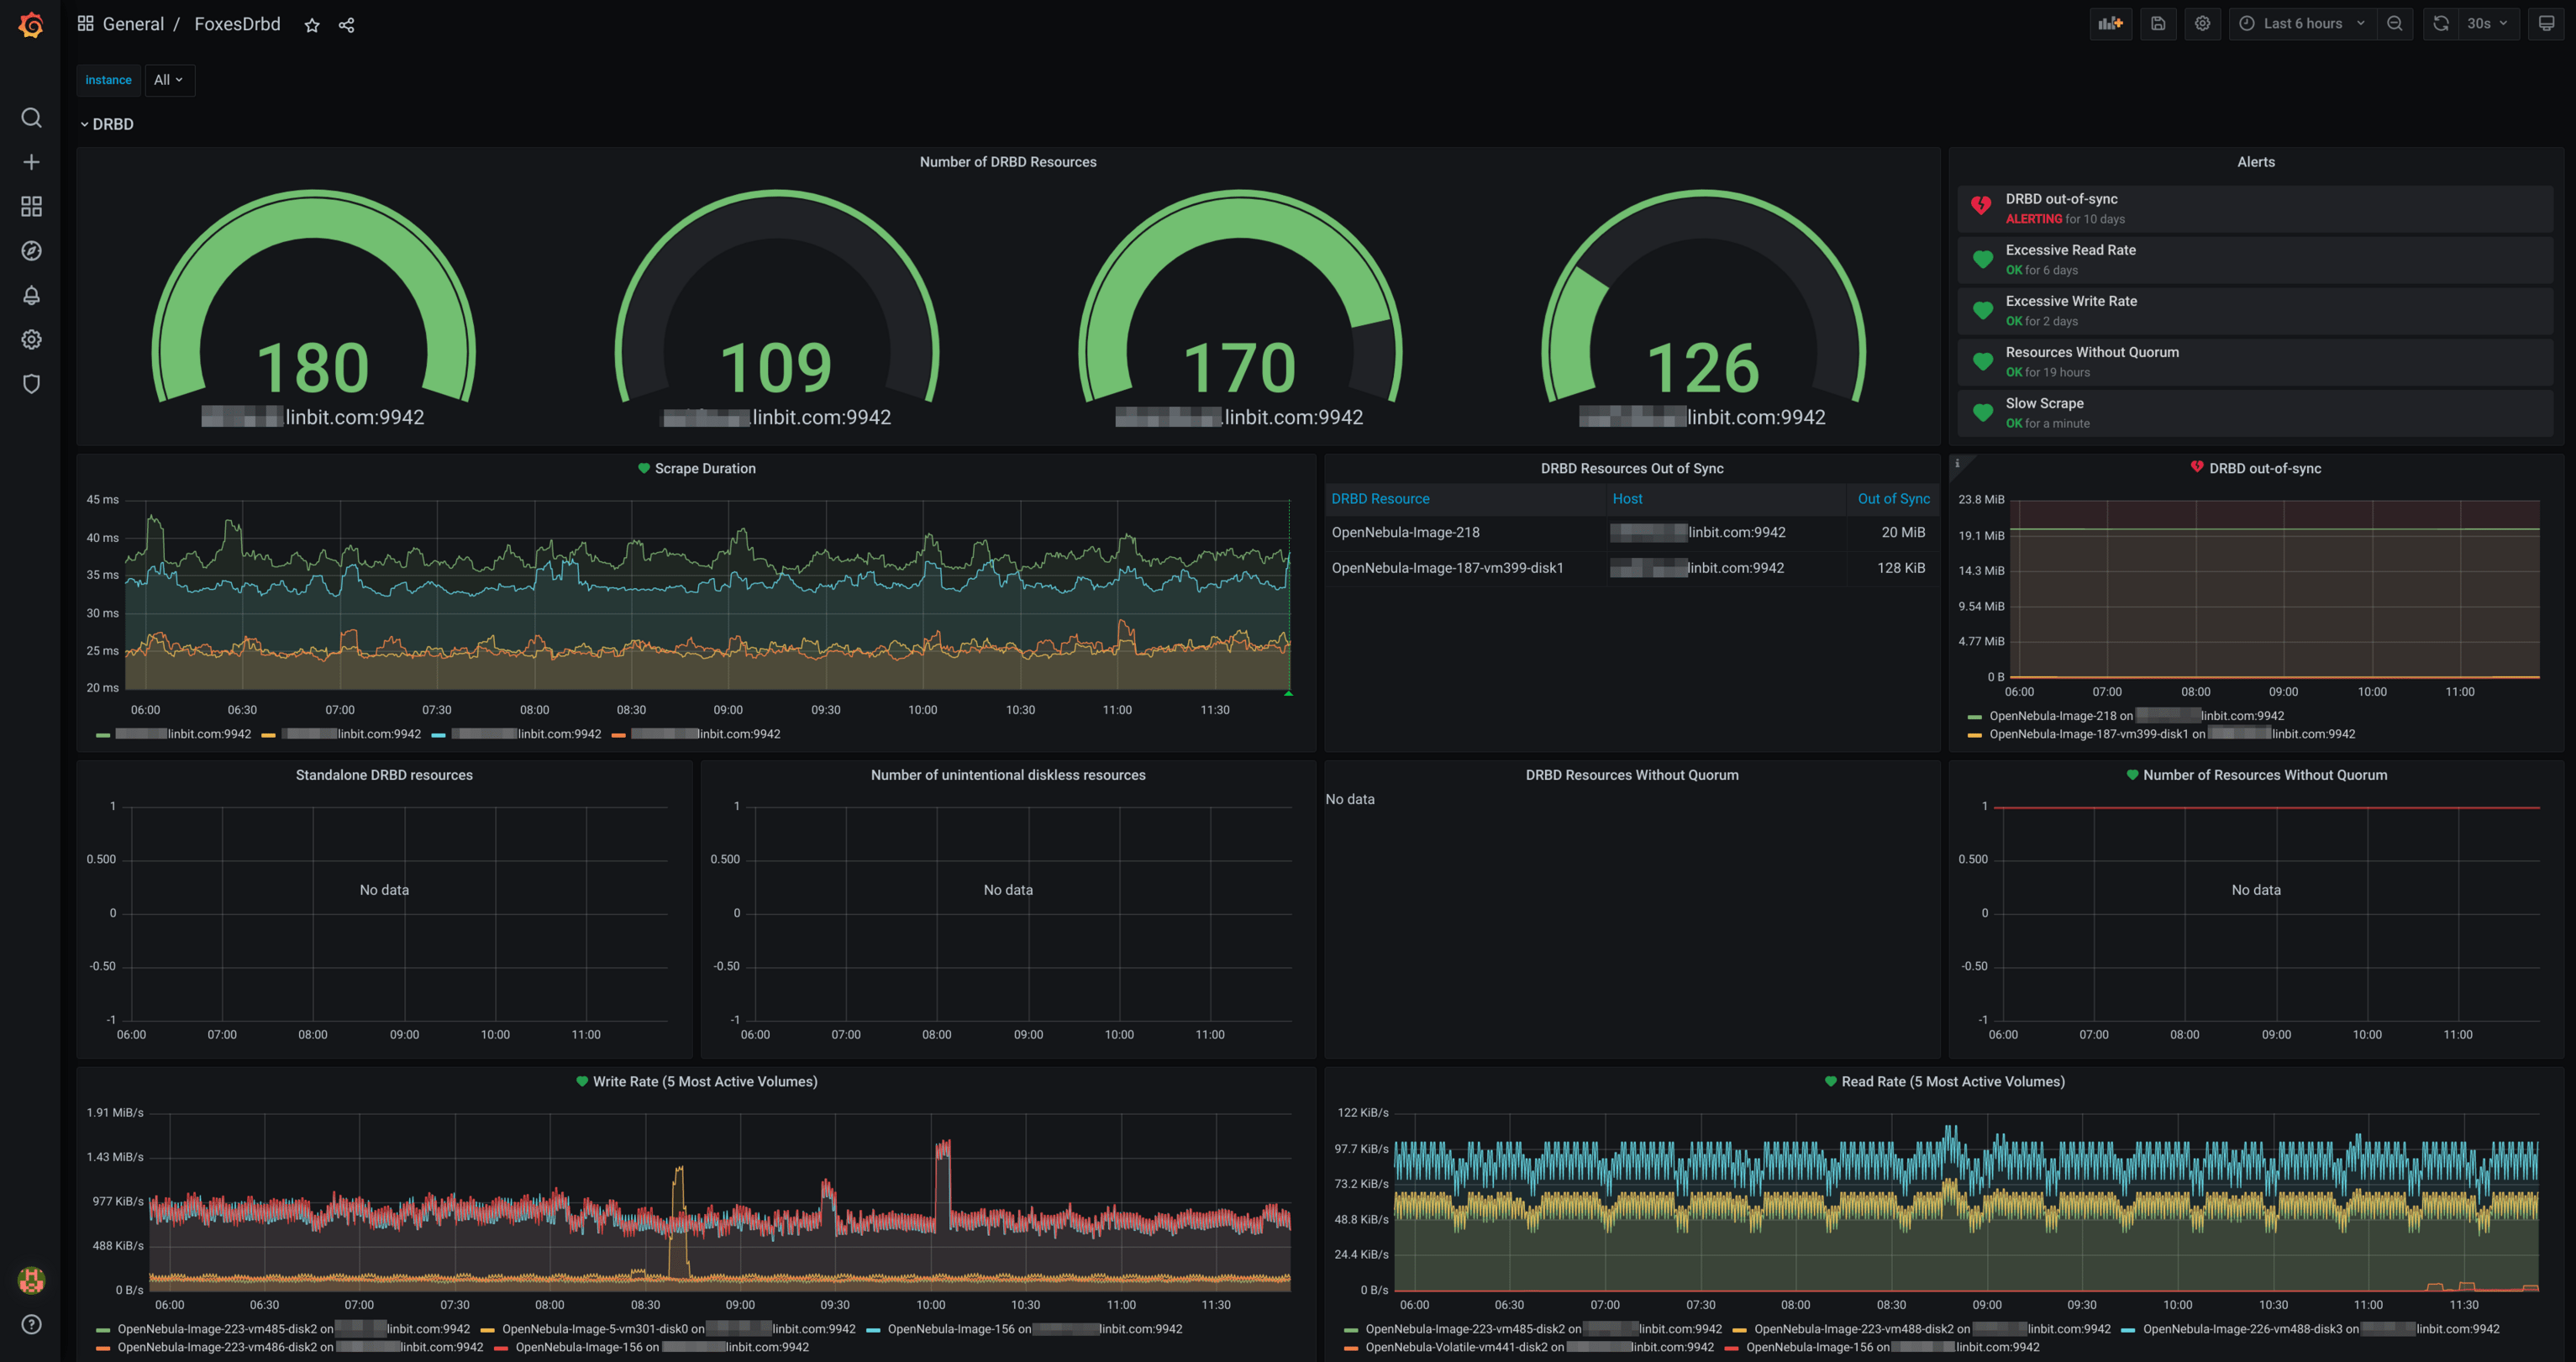
DRBD Grafana Dashboard
With its Prometheus plugin, drbd-reactor exports a powerful set of Prometheus metrics which can be used to optimally monitor a DRBD deployment.
You can find the source in the drbd-reactor project on GitHub.
Data source config
Collector type:
Collector plugins:
Collector config:
Revisions
Upload an updated version of an exported dashboard.json file from Grafana
| Revision | Description | Created | |
|---|---|---|---|
| Download |