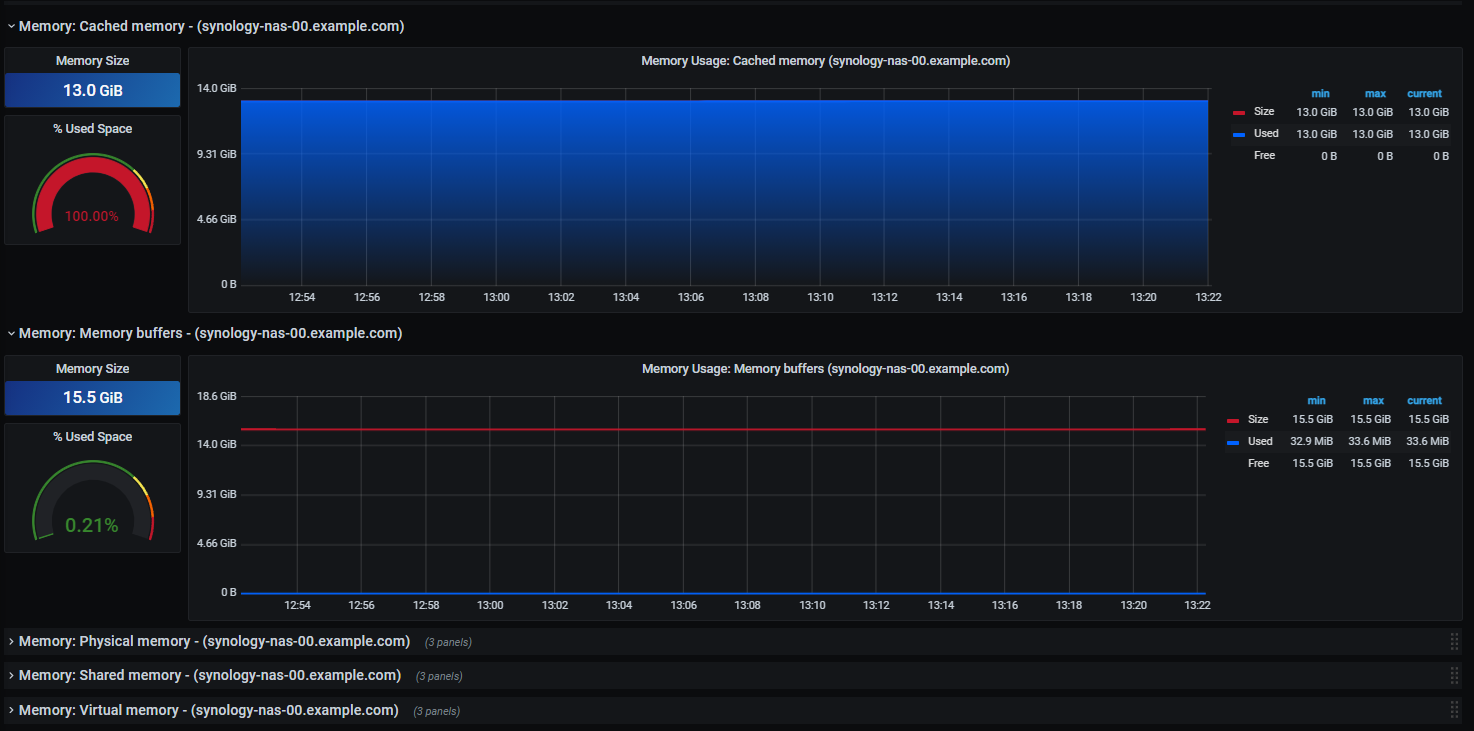
Synology NAS Details
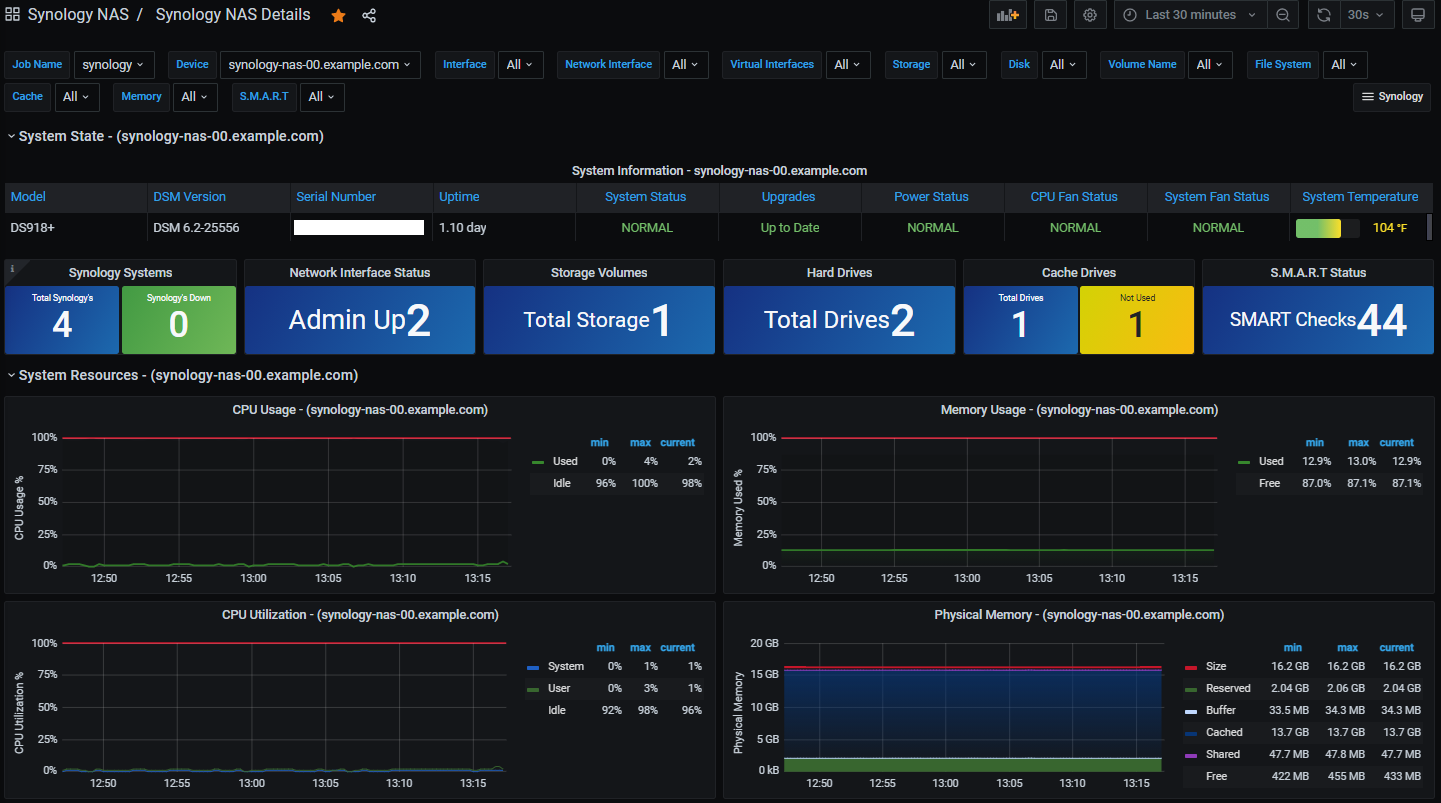
The Synology NAS Details dashboard provides detailed information as to the operational status of the system(s).
If you have multiple Synology devices (or even just one) check out the Synology NAS Overview dashboard meant to complement this one. https://grafana.com/grafana/dashboards/14364
This dashboard utilizes Prometheus and the snmp_exporter to gather various statistics from Synology NAS devices. It has been tested on DSM 6.2, DSM 7.0, DSM 7.1 and DSM 7.2 utilizing DS1511+, DS1512+, DS1513+, DS918+, DS920+ and DS923+ hardware.
Requires: https://github.com/prometheus/snmp_exporter
Upon the import of the dashboard, you should be prompted for the DataSource. You should also be asked how many NAS devices you plan to monitor.
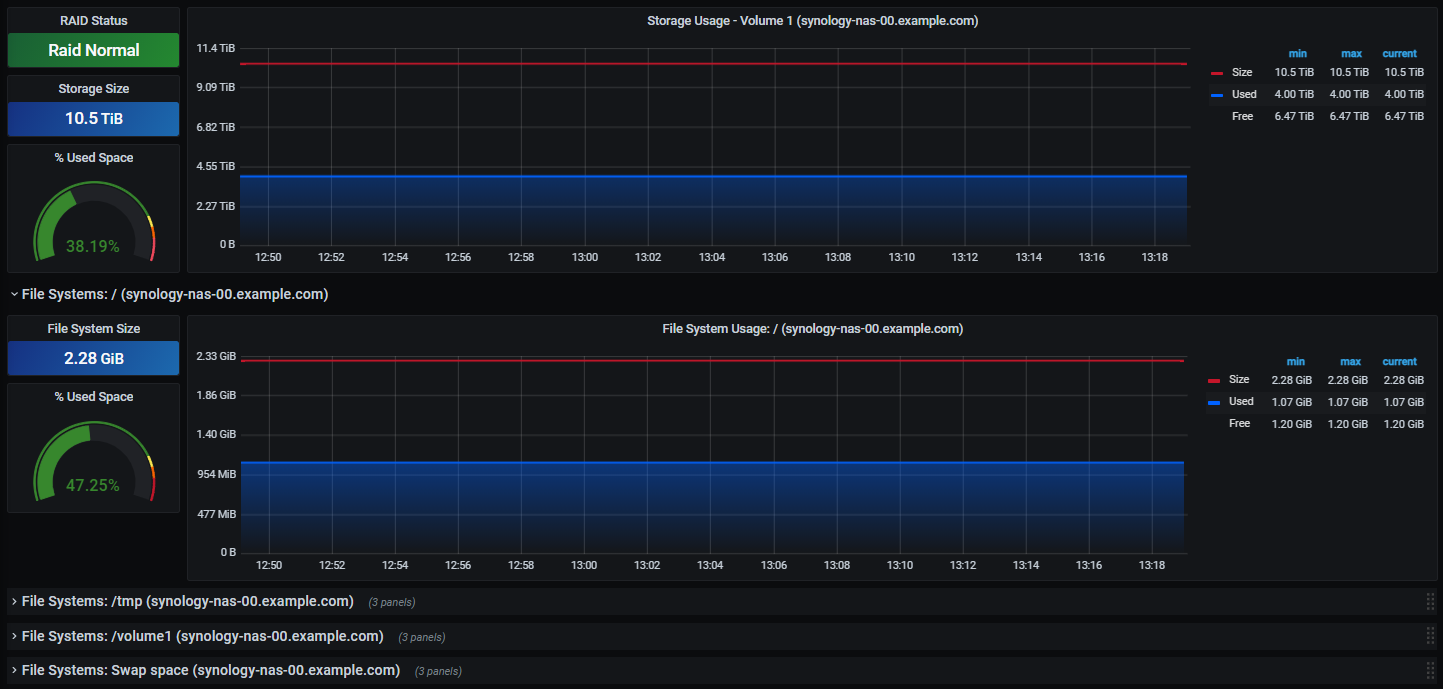
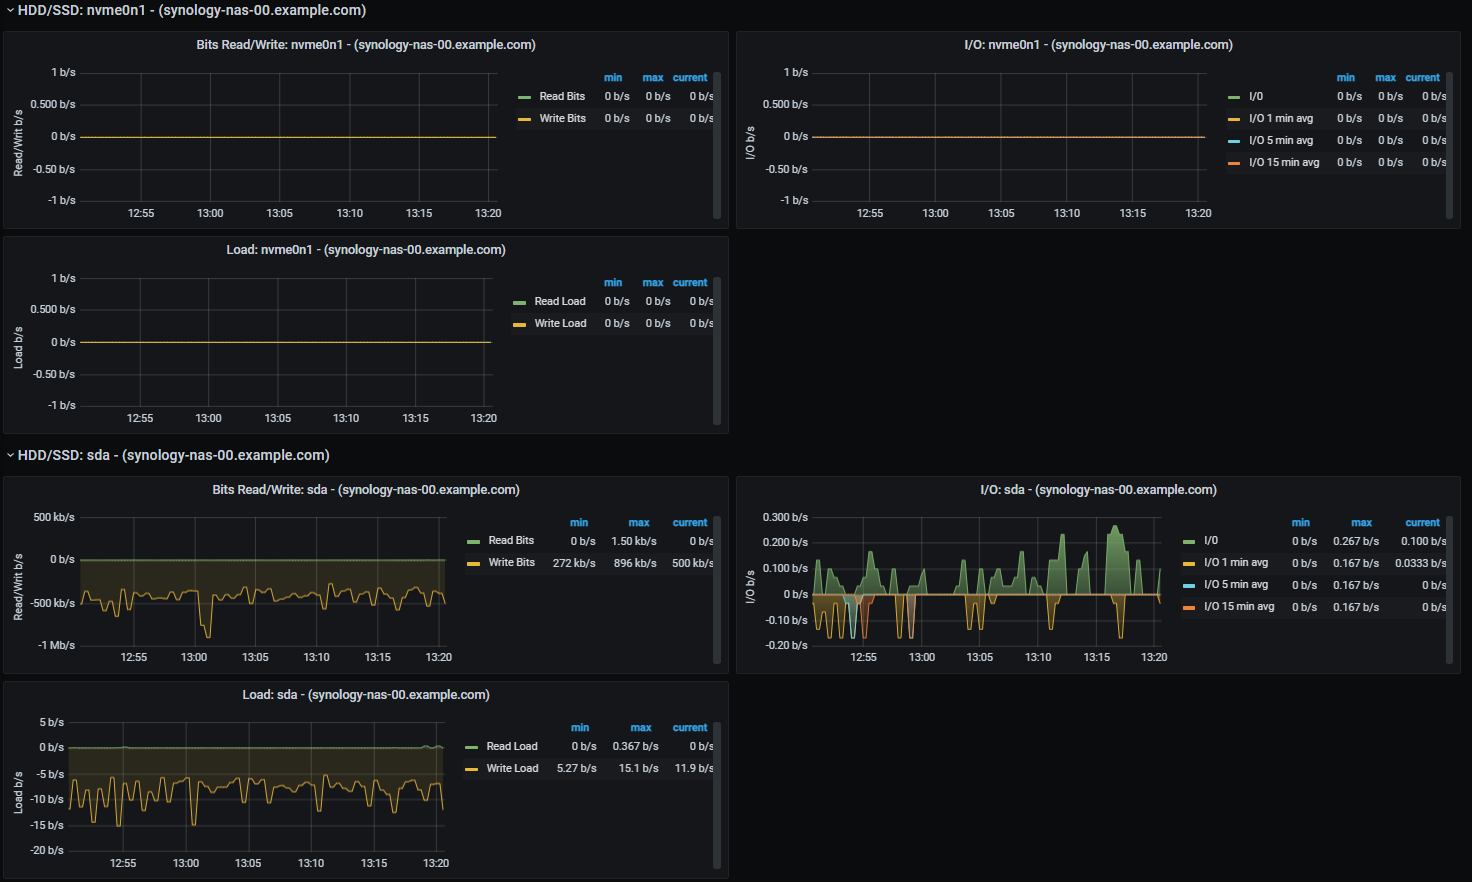
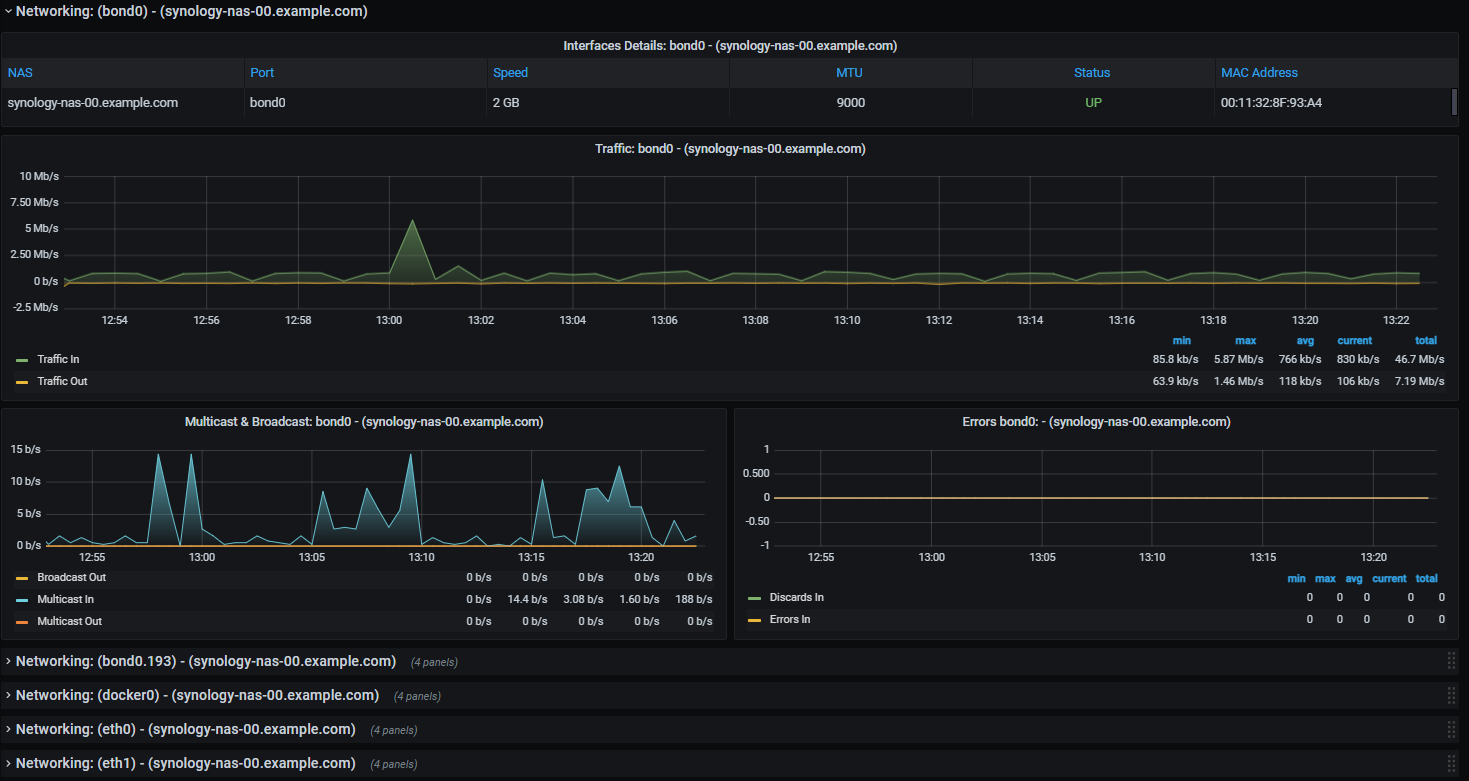
Variables utilizing Regex are used to filter which Network Interfaces, File Systems and Services are displayed. You can enable or disable them from appearing in the dashboard simply by changing the Regex. Another variable named "interfacebits" allows you to set whether you want your network graphs to show bits or bytes (Megabytes set to 1, Megabits set to 8.).
My snmp.yml files used by me can be found here. https://github.com/tumak66/grafana-prometheus-synology
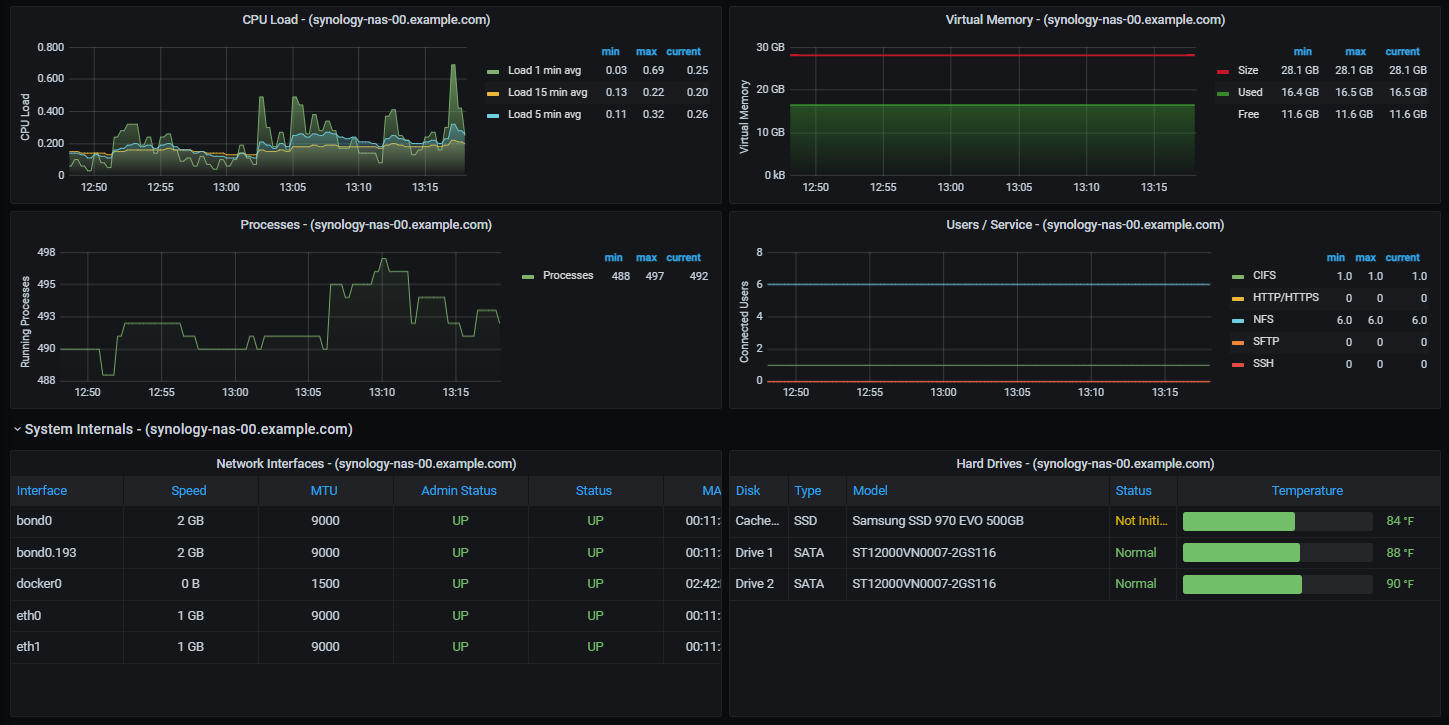
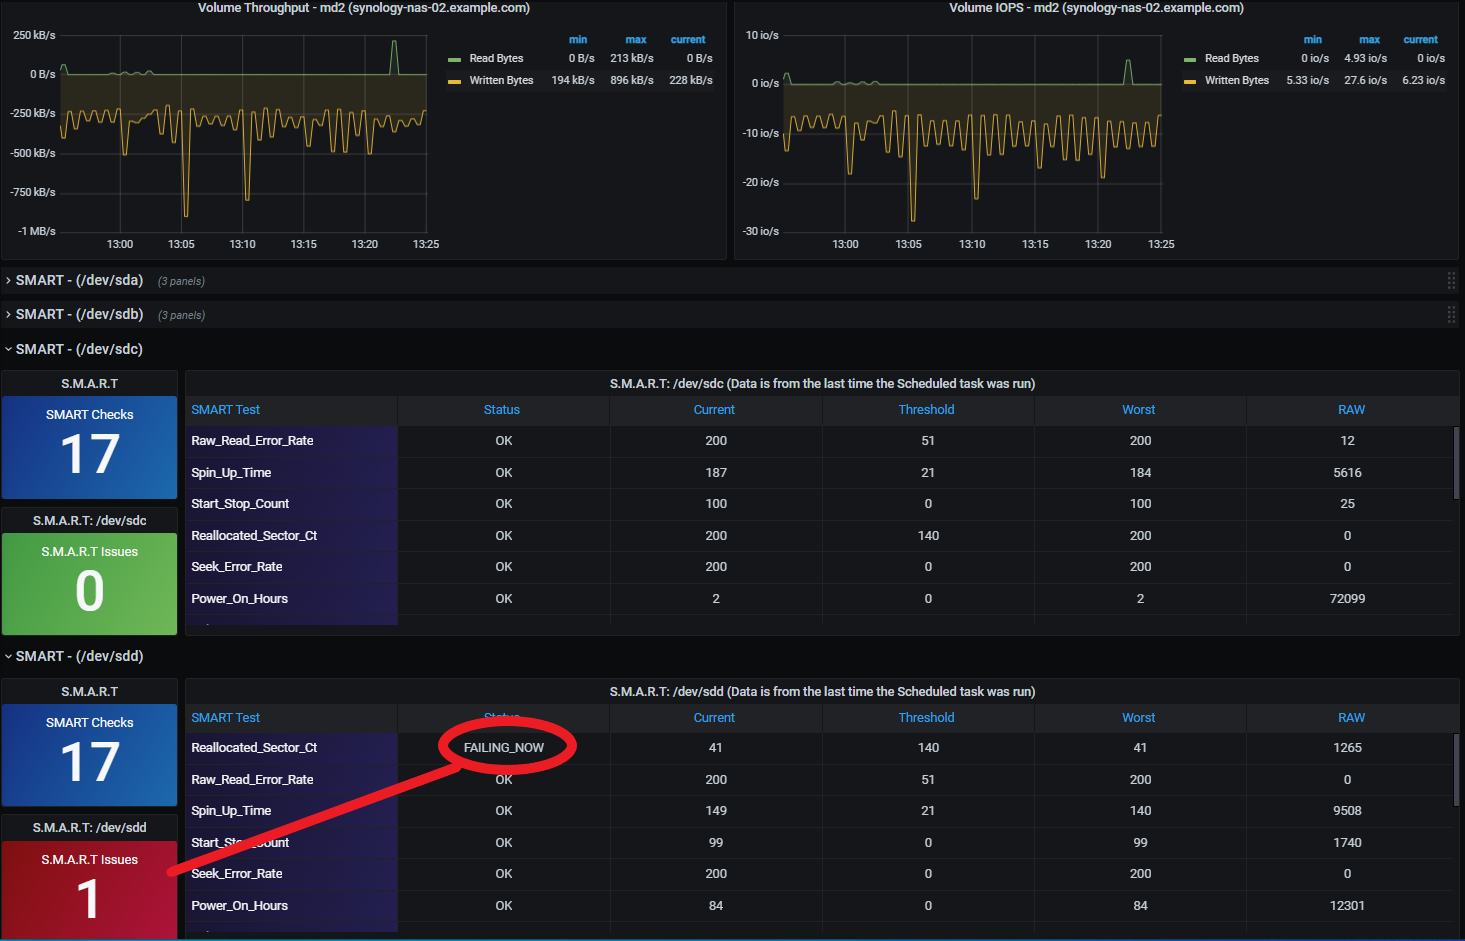
If you have issues with the DSM Version, Serial Number and the Disk in the Hard Drives section not reporting correctly check your snmp.yml file. Make sure that the following are set to use "type: DisplayString". Eventhough my generator.yml was configured with overrides they didn't seem to take affect when generating the snmp.yml file (need to investigate more).
Issue: https://github.com/prometheus/snmp_exporter/issues/650
(everywhere you see diskID in the snmp.yml needs to be changed)
- name: serialNumber oid: 1.3.6.1.4.1.6574.1.5.2 type: DisplayString help: The serial number of this NAS - 1.3.6.1.4.1.6574.1.5.2
- name: version oid: 1.3.6.1.4.1.6574.1.5.3 type: DisplayString help: The version of this DSM - 1.3.6.1.4.1.6574.1.5.3
- name: diskID oid: 1.3.6.1.4.1.6574.2.1.1.2 type: DisplayString help: Synology disk ID The ID of disk is assigned by disk Station. - 1.3.6.1.4.1.6574.2.1.1.2 indexes:
- labelname: diskIndex type: gauge lookups:
- labels:
- diskIndex labelname: diskID oid: 1.3.6.1.4.1.6574.2.1.1.2 type: DisplayString
- labels: [] labelname: diskIndex
Data source config
Collector config:
Upload an updated version of an exported dashboard.json file from Grafana
| Revision | Description | Created | |
|---|---|---|---|
| Download |