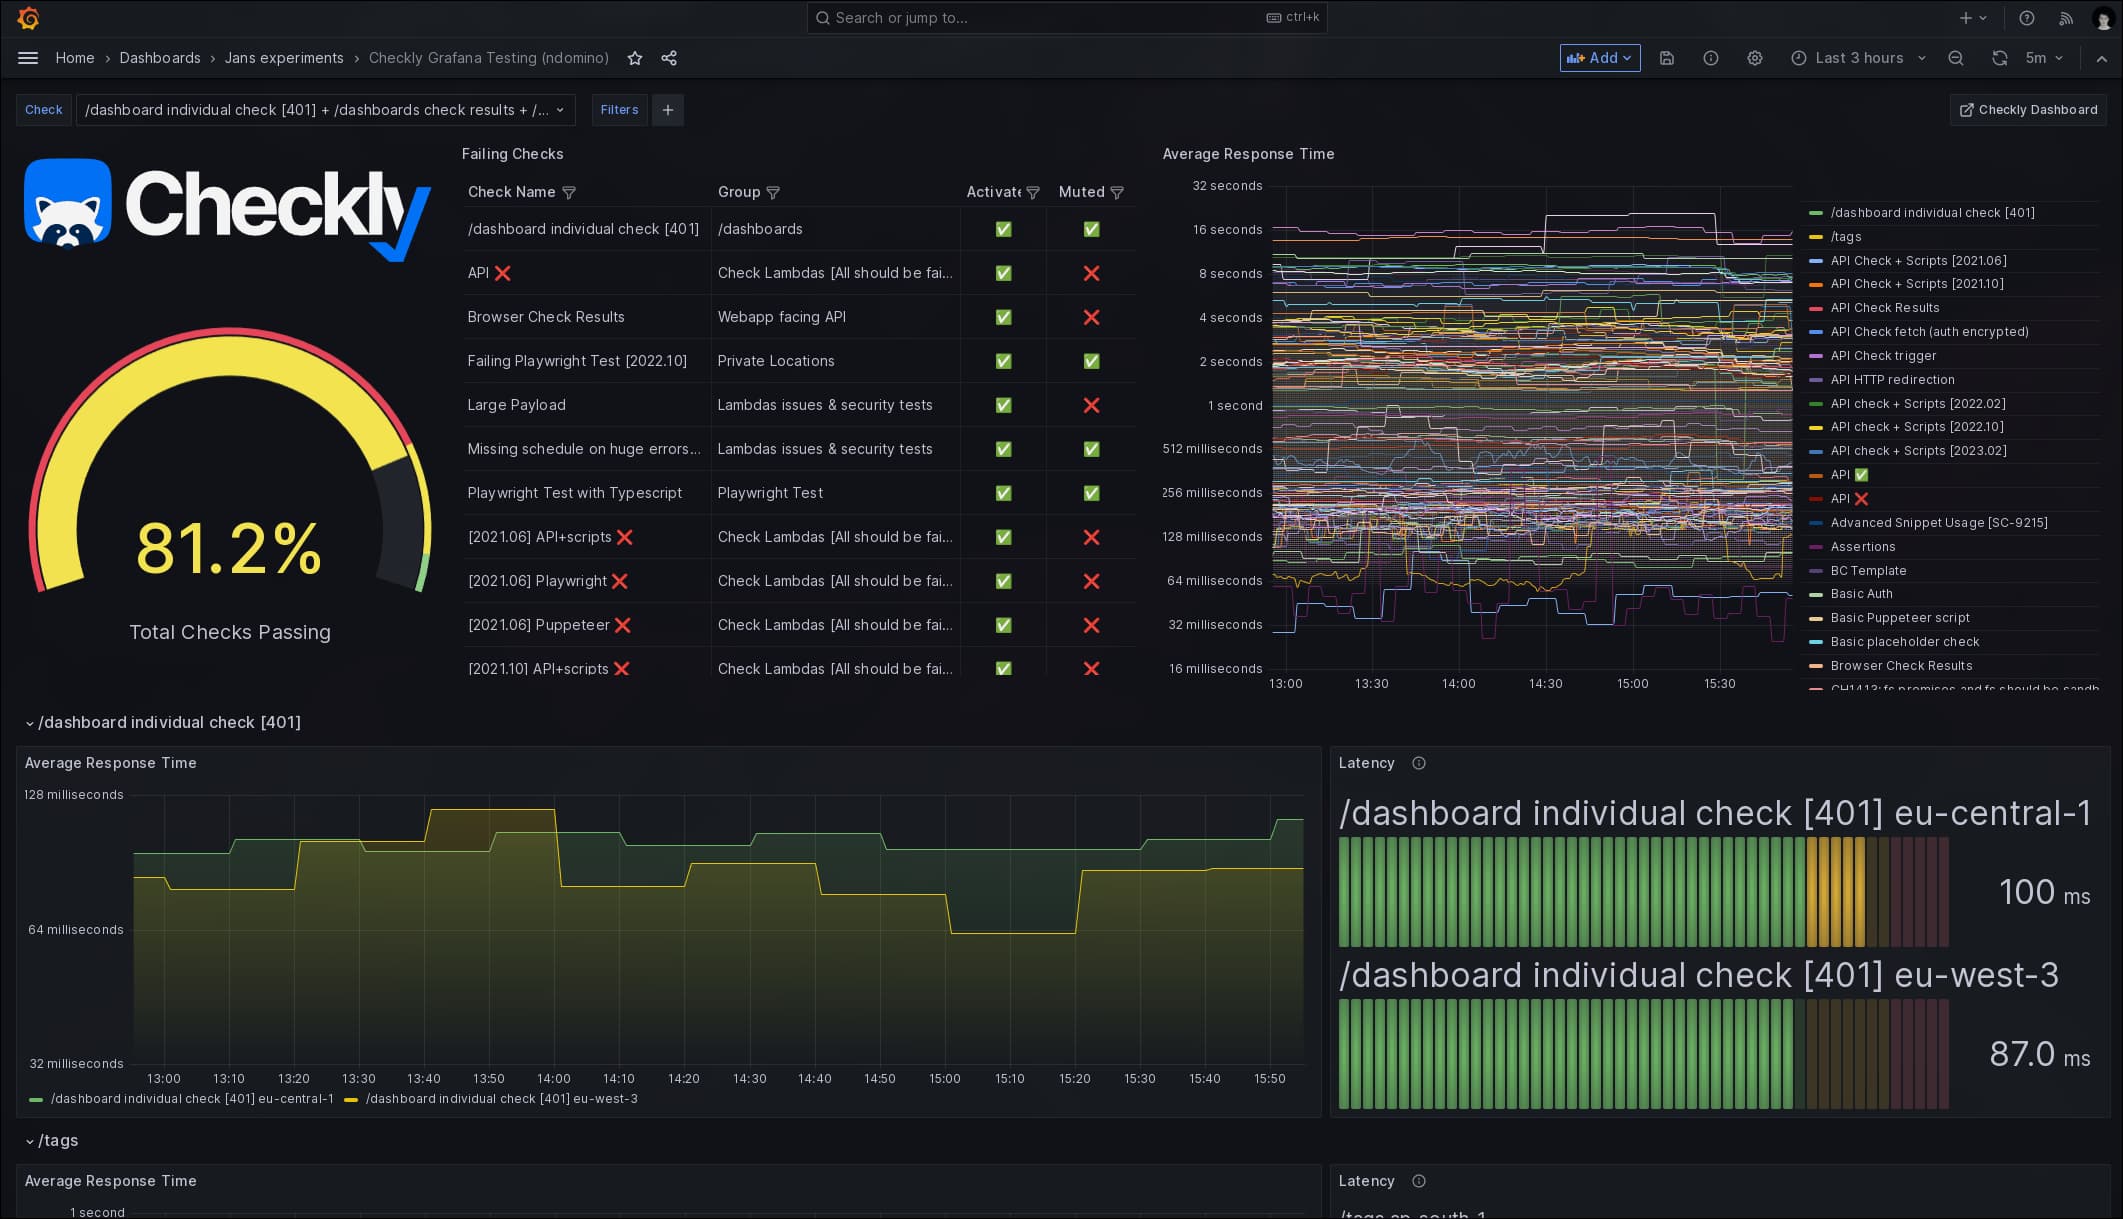
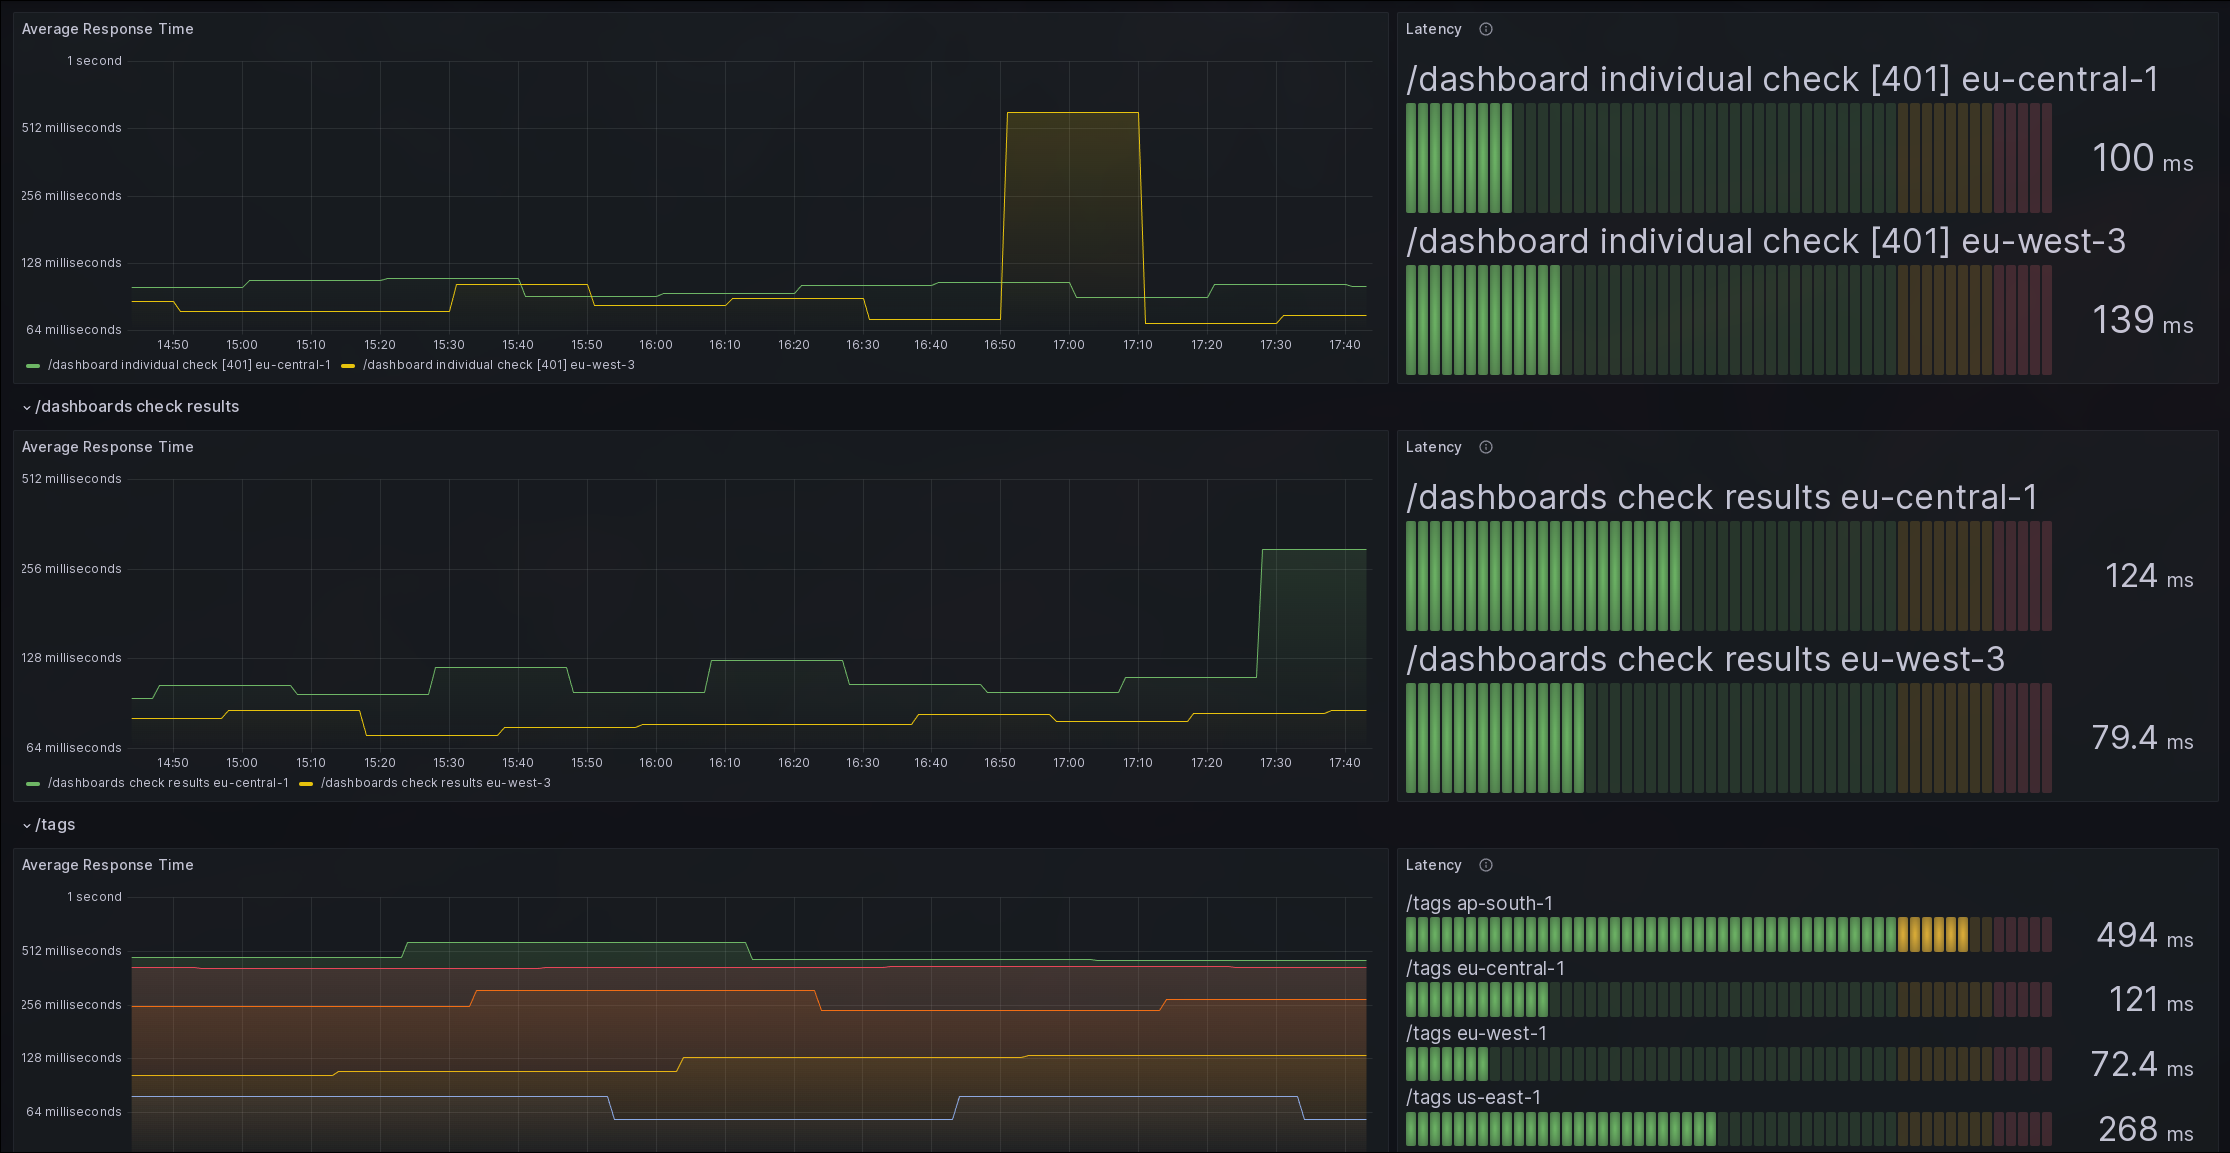
Checkly Dashboard v1
[Community] Display your data from Checkly's Prometheus V1 integration
Community Checkly Grafana Dashboard
This dashboard is based on the data provided by Checkly (checklyhq.com) and their v1 Prometheus integration.
Getting Started
To use this dashboard, make sure you have Checkly's v1 Prometheus integration activated. For more information on how to setup the integration, please go here. Then input this dashboards ID (14277) in your Grafana Dashboard under "Dashboards" -> "Manage" -> "Import".
Feel free to use this as a starting point to make your own Checkly Grafana Dashboard!
Data source config
Collector config:
Upload an updated version of an exported dashboard.json file from Grafana
| Revision | Description | Created | |
|---|---|---|---|
| Download |


