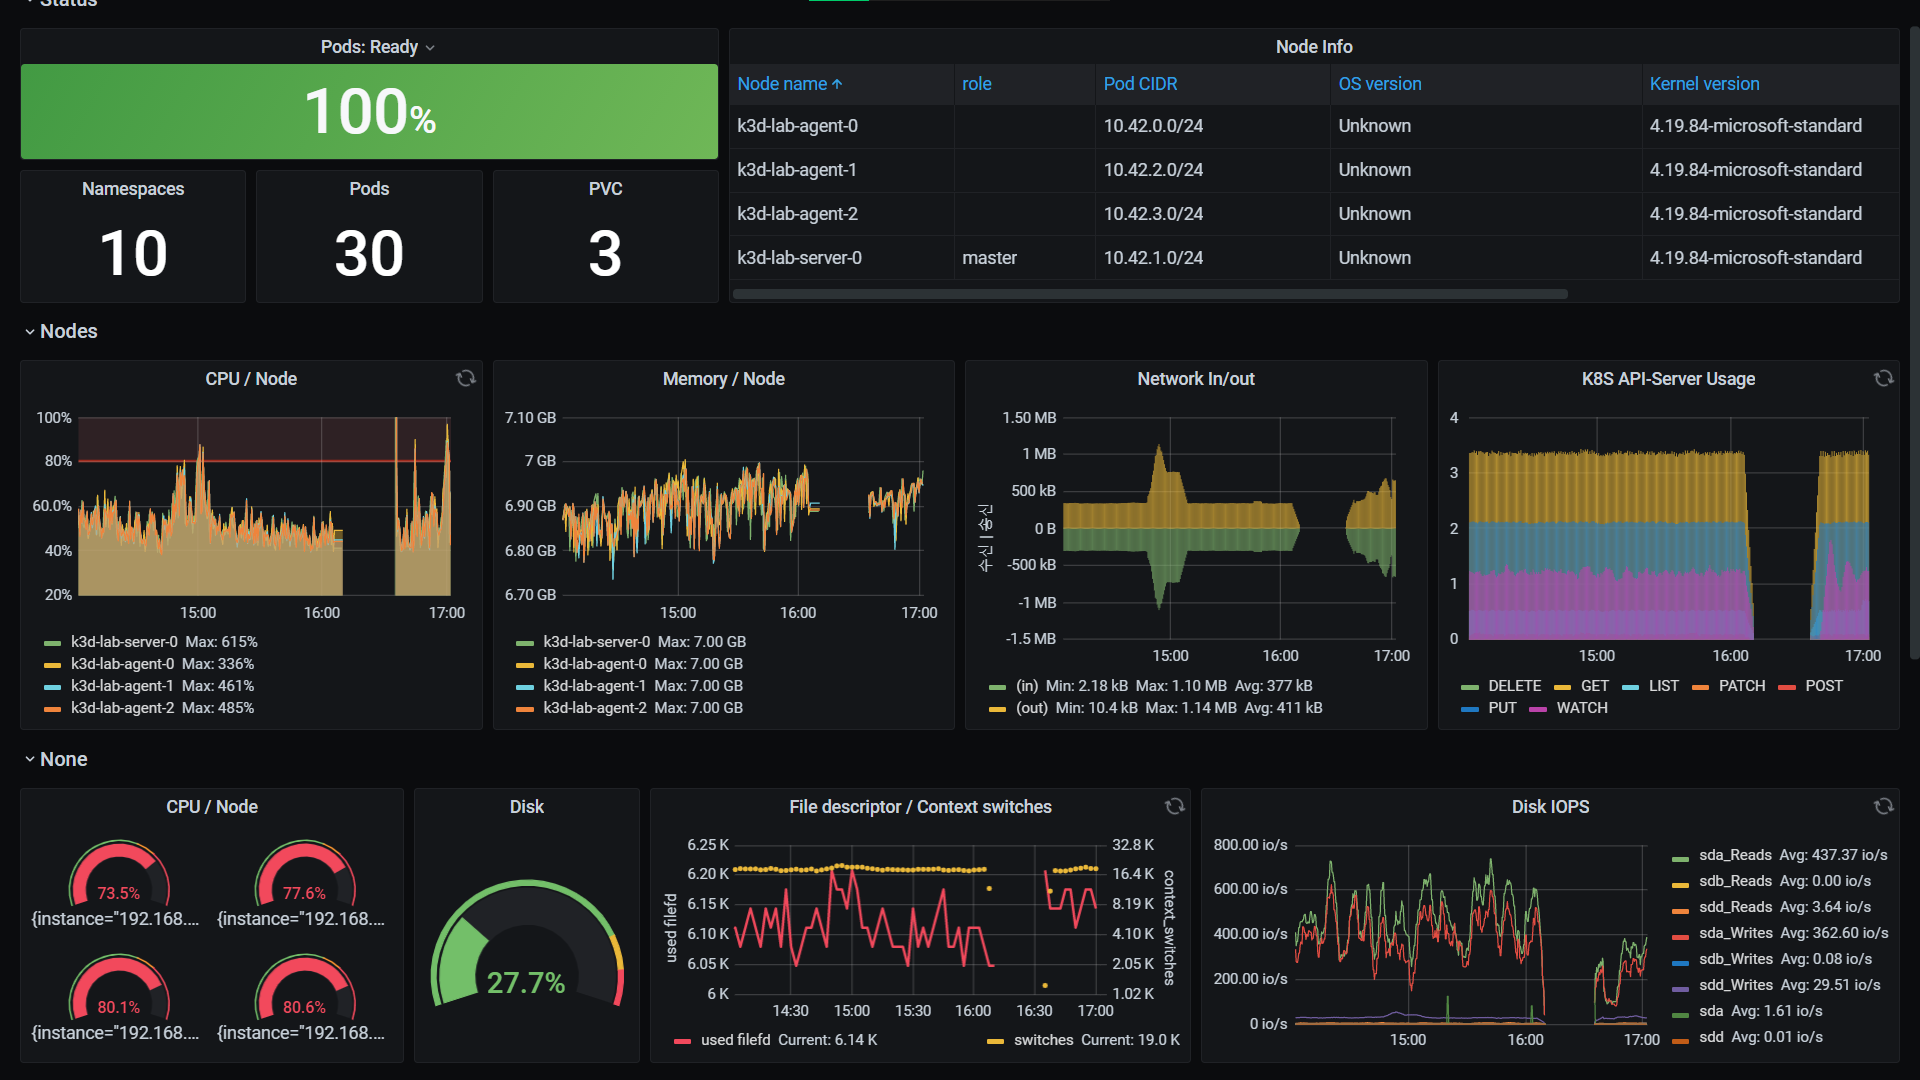
K8S Cluster Monitor
English version of an Asian dashboard found on grafana.com/dashboards
A visually appealing breakdown of kubernetes statistics. This isn't fully working yet, as you'll see, but it's a great start.
Data source config
Collector config:
Upload an updated version of an exported dashboard.json file from Grafana
| Revision | Description | Created | |
|---|---|---|---|
| Download |
Kubernetes
Monitor your Kubernetes deployment with prebuilt visualizations that allow you to drill down from a high-level cluster overview to pod-specific details in minutes.
Learn more
