
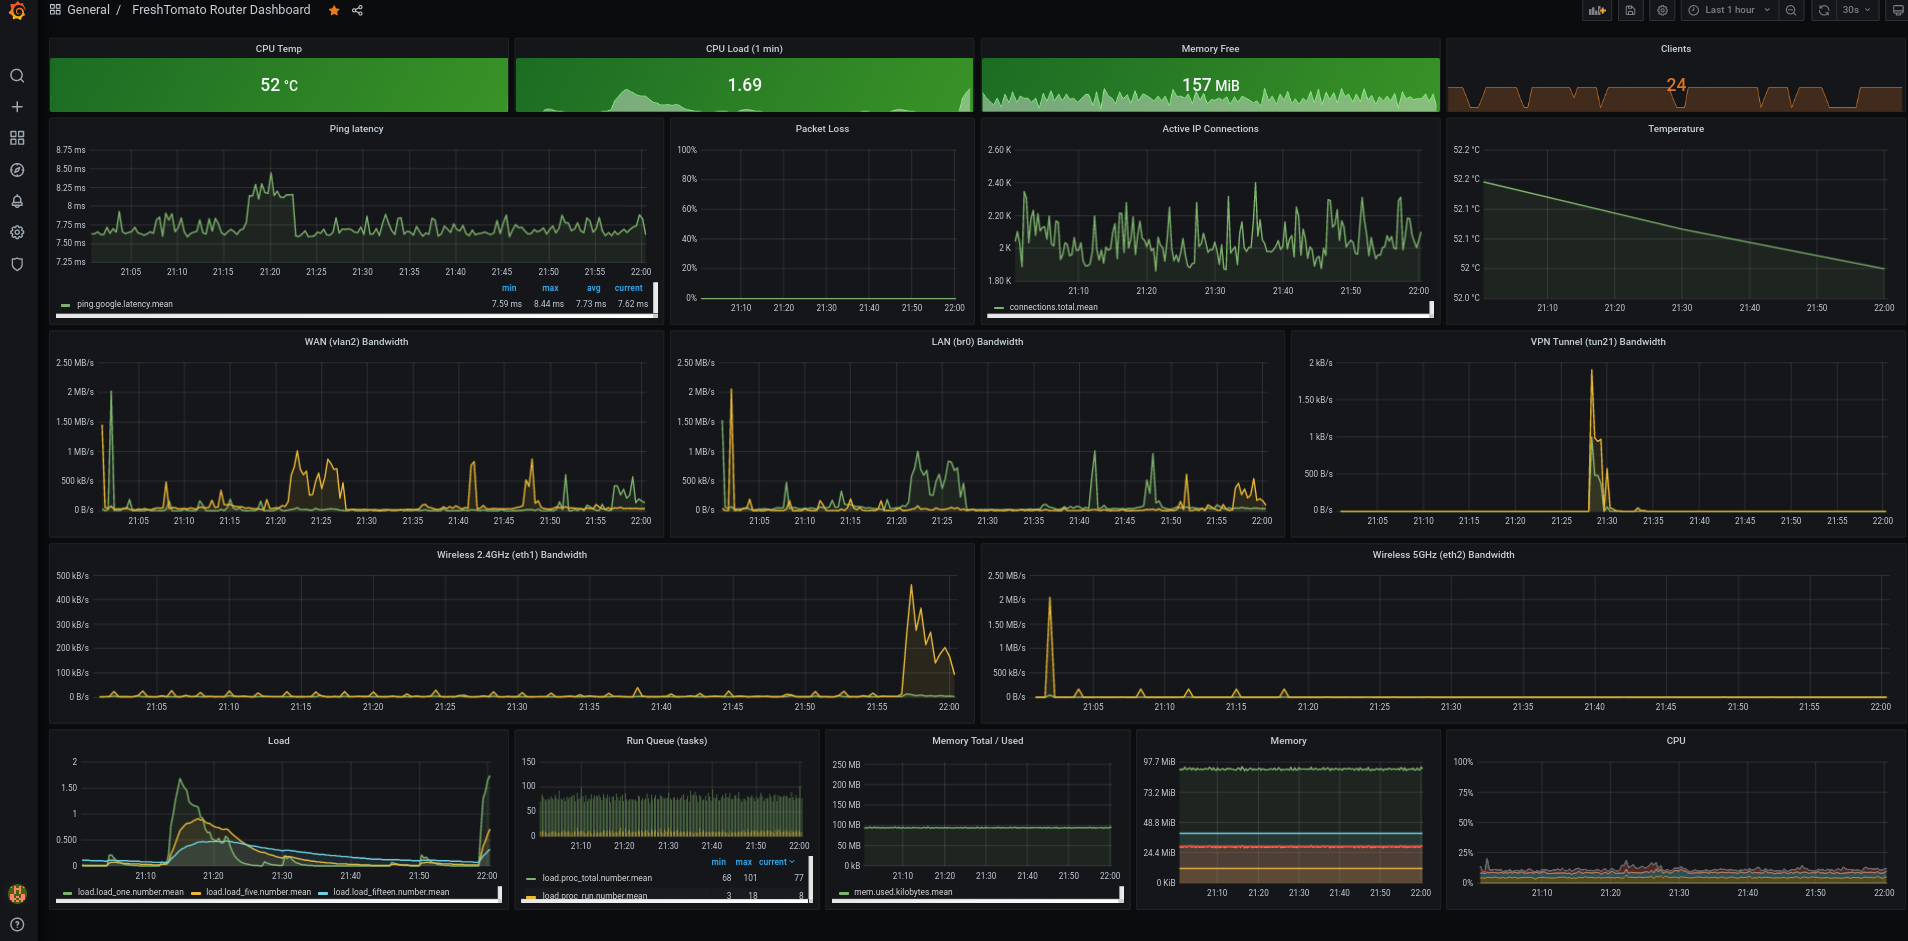
FreshTomato Router Dashboard
Scripts to display metrics from routers running FreshTomato. Developed on Netgear R7000.
Based on dd-wrt-grafana by Trevor Dodds (https://grafana.com/grafana/dashboards/950), updated for influxdb and freshtomato.
Requirements: Router running FreshTomato (tested on 2021.2) Server running Grafana Server running InfluxDB with auth-enabled=true
Installation:
Enable JFFS support on Tomato under Administration -> JFFS.
Upload all shell scripts from https://github.com/ch604/tomato-grafana to /jffs/tomato-grafana/. Modify the IP, port, password, and username of your influxdb server in variables.sh. Also add any additional mount points you may want to monitor in this file as well, space-delimited.
For speedtest results, download the Ookla ARM CLI tool from https://install.speedtest.net/app/cli/ookla-speedtest-1.0.0-arm-linux.tgz and place its contents into a folder called /jffs/speedtest/.
Add the following three commands under Administration -> Scheduler as custom cron jobs:
sh /jffs/tomato-grafana/collector.sh >/dev/null 2>&1
sh /jffs/tomato-grafana/collector20.sh >/dev/null 2>&1
sh /jffs/tomato-grafana/collector40.sh >/dev/null 2>&1
These should all run every 1 minute on every day of the week.
Add the following cron as well for speed tests:
sh /jffs/tomato-grafana/speedTest.sh >/dev/null 2>&1
This should run every 30 minutes, or as often as you would like results recorded.
Import Grafana json dashboard.
Enjoy!
Data source config
Collector config:
Dashboard revisions
Upload an updated version of an exported dashboard.json file from Grafana
| Revision | Decscription | Created | |
|---|---|---|---|
| Download |
Get this dashboard
Data source:
Dependencies: