
GCP Stackdriver
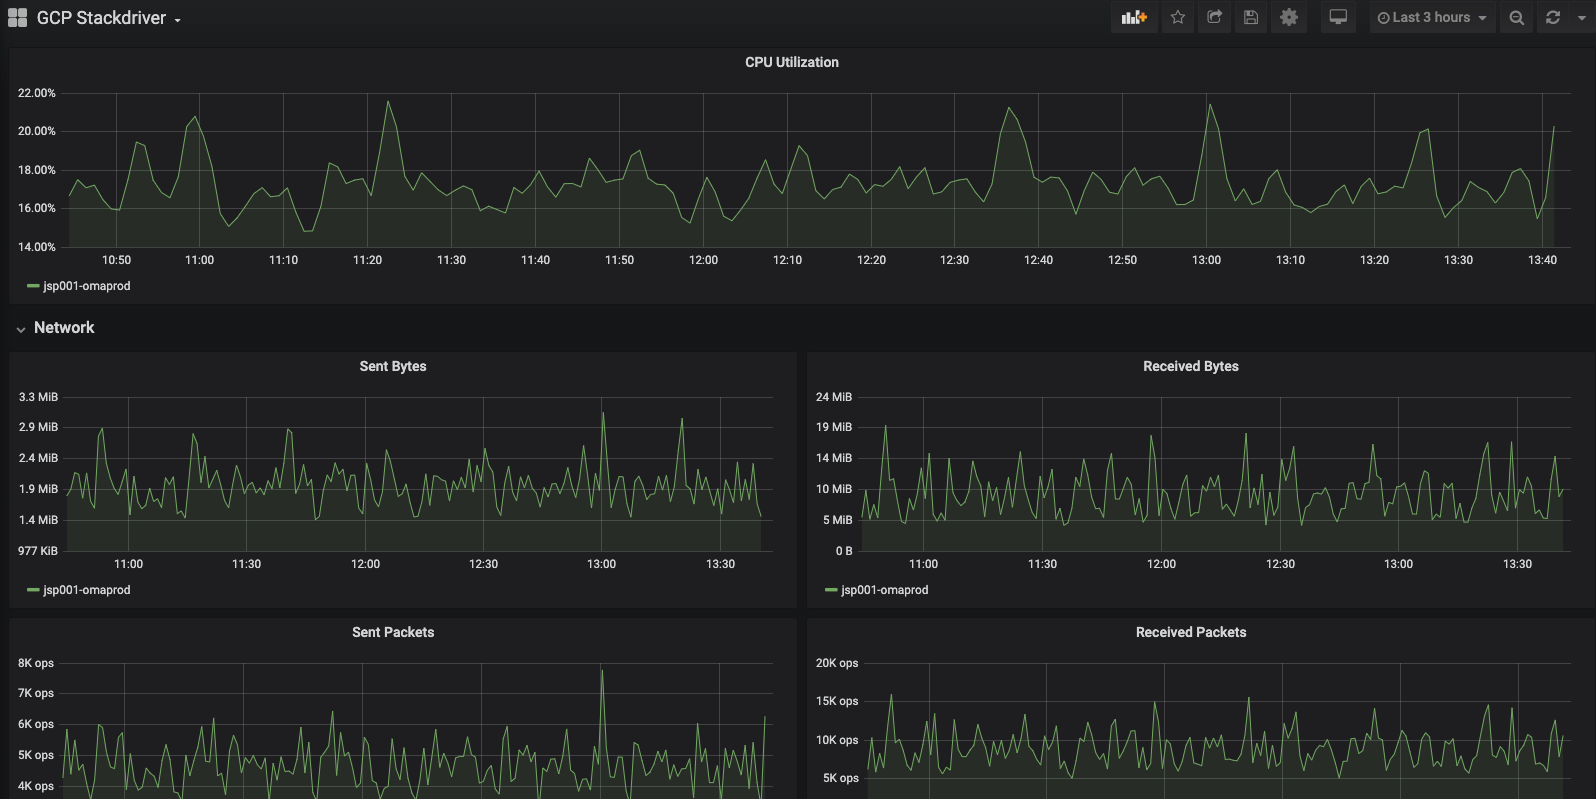
VM metrics from GCP Stackdriver
Connect your GCP service account with grafana https://grafana.com/docs/grafana/latest/datasources/google-cloud-monitoring/
Select your project and view all of the Stackdriver metrics from the hypervisor.
Includes throttled disk operations and dropped packets
Data source config
Collector type:
Collector plugins:
Collector config:
Dashboard revisions
Upload an updated version of an exported dashboard.json file from Grafana
| Revision | Decscription | Created | |
|---|---|---|---|
| Download |
Sign up for Grafana Cloud

Get up and running in minutes with the Grafana Cloud free tier, which includes free forever 10k metrics, 50GB logs, 50GB traces, 500 VUh, and more.
Get this dashboard
Data source:
Dependencies: